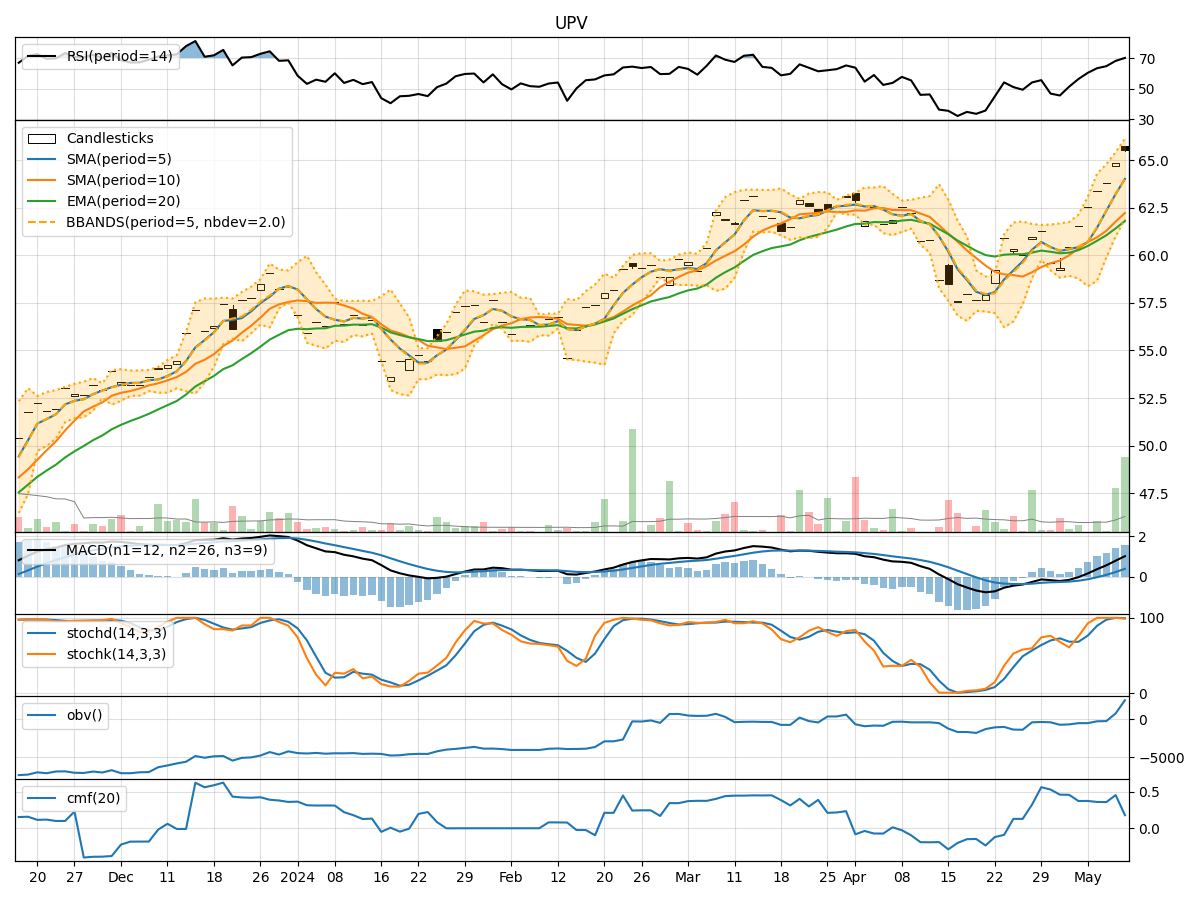
Technical Analysis of UPV 2024-05-10
Overview:
In analyzing the technical indicators for UPV stock over the last 5 days, we will delve into the trend, momentum, volatility, and volume indicators to provide a comprehensive outlook on the possible stock price movement in the upcoming days.
Trend Analysis:
- Moving Averages (MA): The 5-day Moving Average has been consistently rising, indicating a bullish trend.
- MACD: The MACD line has been above the signal line, suggesting a bullish momentum.
- EMA: The Exponential Moving Average has been steadily increasing, supporting the bullish trend.
Momentum Analysis:
- RSI: The Relative Strength Index has been in the overbought territory, signaling a strong bullish momentum.
- Stochastic Oscillator: Both %K and %D have been at high levels, indicating a strong bullish momentum.
- Williams %R: The indicator has been in the oversold region, suggesting a potential reversal.
Volatility Analysis:
- Bollinger Bands: The stock price has been consistently trading above the upper Bollinger Band, indicating an overbought condition.
- Bollinger %B: The %B indicator has been above 0.8, signaling a potential reversal or correction.
Volume Analysis:
- On-Balance Volume (OBV): The OBV has been increasing, reflecting strong buying pressure.
- Chaikin Money Flow (CMF): The CMF has been positive, indicating a bullish money flow into the stock.
Key Observations:
- The stock is in a strong bullish trend based on moving averages and MACD.
- Momentum indicators suggest a continuation of the bullish momentum.
- Volatility indicators point towards a potential overbought condition.
- Volume indicators support the bullish trend with increasing buying pressure.
Conclusion:
Based on the analysis of technical indicators, the stock is likely to continue its upward movement in the next few days. However, caution is advised as the stock is showing signs of being overbought based on volatility indicators. Traders should closely monitor the price action for any signs of a potential reversal or correction in the near term.