Technical Analysis of URE 2024-05-10
Overview:
In analyzing the technical indicators for URE over the last 5 days, we will delve into the trend, momentum, volatility, and volume indicators to provide a comprehensive outlook on the possible stock price movement in the coming days. By examining these key aspects, we aim to offer valuable insights and predictions for informed decision-making.
Trend Analysis:
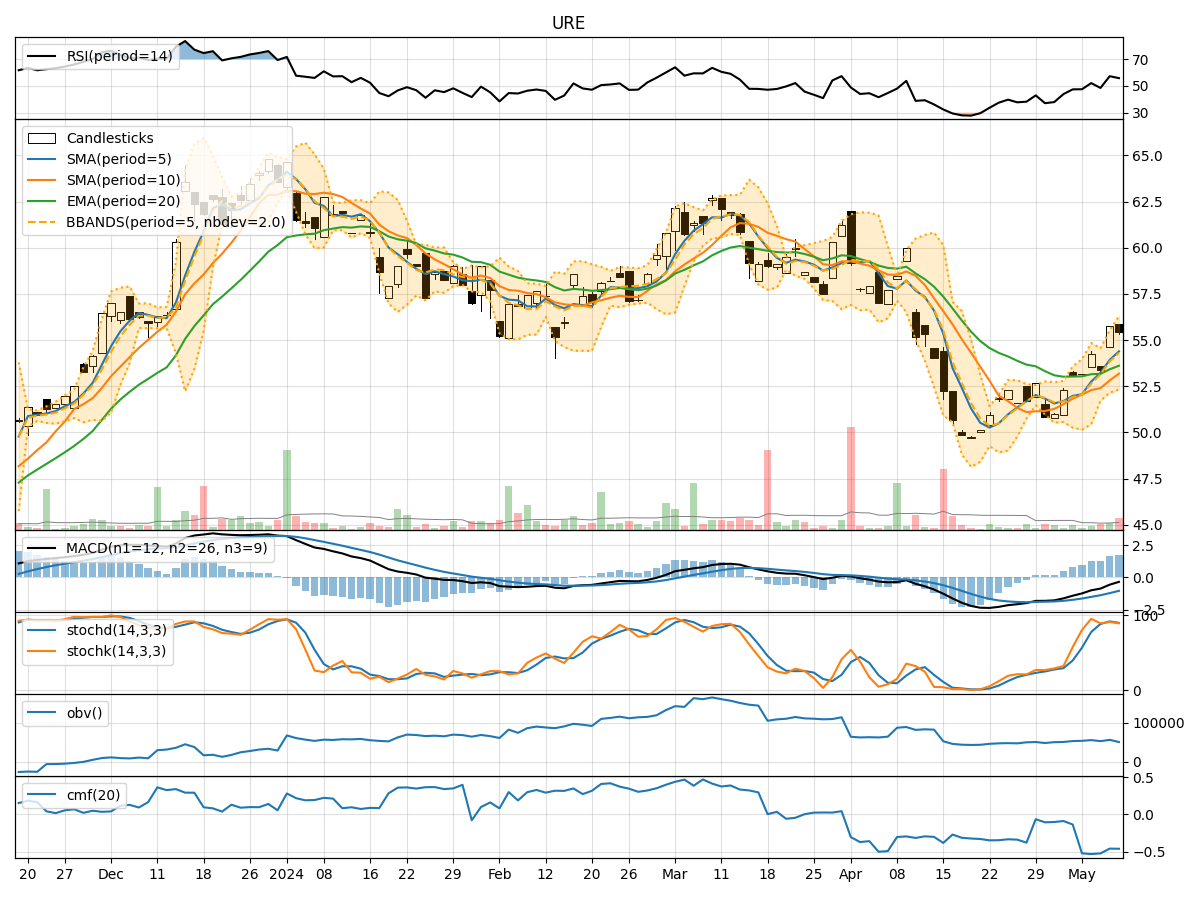
- Moving Averages (MA): The 5-day Moving Average (MA) has been showing an upward trend, indicating a positive momentum in the stock price.
- MACD: The Moving Average Convergence Divergence (MACD) has been consistently increasing, suggesting a strengthening bullish trend.
- RSI: The Relative Strength Index (RSI) has been fluctuating but generally staying within the neutral range, indicating a balanced market sentiment.
Key Observation: The trend indicators point towards a bullish outlook for URE in the near term.
Momentum Analysis:
- Stochastic Oscillator: The Stochastic Oscillator has been fluctuating but has not reached extreme levels, indicating potential room for further price movement.
- Williams %R: The Williams %R is showing oversold conditions on some days but has not remained in that zone consistently.
Key Observation: The momentum indicators suggest a neutral to slightly bullish momentum for URE.
Volatility Analysis:
- Bollinger Bands: The Bollinger Bands have been widening, indicating increased volatility in the stock price.
- Volatility Percentage: The volatility percentage has been relatively high, reflecting significant price fluctuations.
Key Observation: The volatility indicators signal increased volatility in URE, which could lead to both opportunities and risks for traders.
Volume Analysis:
- On-Balance Volume (OBV): The OBV has been fluctuating, indicating mixed buying and selling pressure.
- Chaikin Money Flow (CMF): The CMF has been negative, suggesting a net outflow of money from the stock.
Key Observation: The volume indicators show mixed signals with no clear direction in terms of buying or selling pressure.
Conclusion:
Based on the analysis of trend, momentum, volatility, and volume indicators, the overall outlook for URE in the next few days appears to be bullish with a neutral to slightly bullish momentum. However, the increased volatility and mixed volume signals indicate a degree of uncertainty in the market.
Therefore, the next few days may see URE experiencing upward price movements with potential fluctuations due to increased volatility. Traders should closely monitor key levels and market developments to capitalize on potential opportunities while managing risks effectively.