Technical Analysis of URTH 2024-05-10
Overview:
In analyzing the technical indicators for URTH over the last 5 days, we will delve into the trend, momentum, volatility, and volume indicators to provide a comprehensive outlook on the possible stock price movement. By examining these key factors, we aim to offer valuable insights and predictions for the upcoming days.
Trend Analysis:
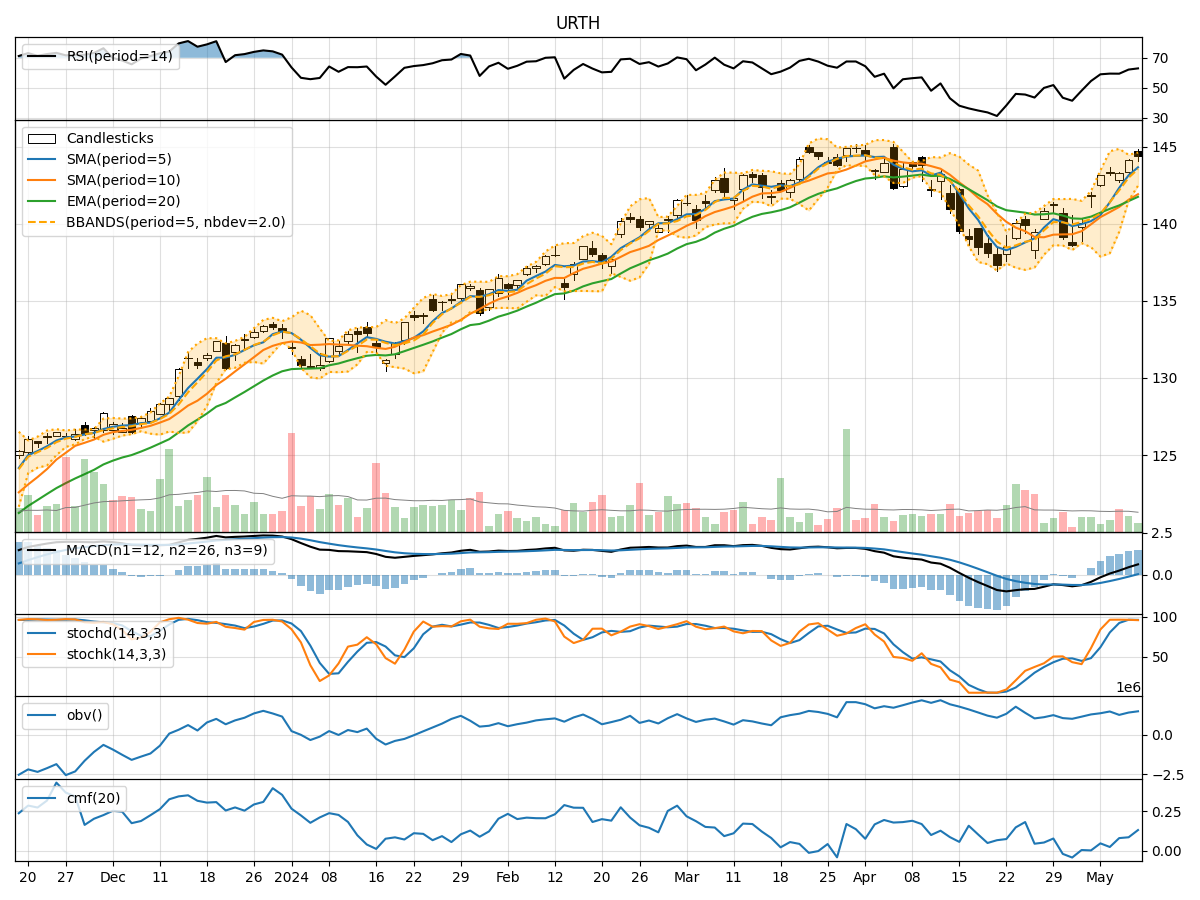
- Moving Averages (MA): The 5-day moving average has been consistently above the simple moving average (SMA) and exponential moving average (EMA), indicating a bullish trend.
- MACD: The MACD line has been consistently above the signal line, with both lines showing an upward trend, suggesting bullish momentum.
Momentum Analysis:
- RSI: The Relative Strength Index (RSI) has been gradually increasing and is currently in the overbought territory, indicating strong buying momentum.
- Stochastic Oscillator: Both %K and %D lines of the Stochastic Oscillator are in the overbought zone, suggesting a potential reversal or consolidation.
Volatility Analysis:
- Bollinger Bands (BB): The stock price has been trading within the upper Bollinger Band, indicating an overbought condition and potential for a pullback.
Volume Analysis:
- On-Balance Volume (OBV): The OBV has been increasing, reflecting higher buying volume and overall positive sentiment.
- Chaikin Money Flow (CMF): The CMF has been positive, indicating that money is flowing into the stock.
Key Observations:
- The trend indicators suggest a strong bullish sentiment, supported by moving averages and MACD.
- Momentum indicators show overbought conditions, signaling a potential reversal or consolidation.
- Volatility indicators point towards a possible pullback as the stock is trading at the upper Bollinger Band.
- Volume indicators reflect increasing buying volume and positive money flow into the stock.
Conclusion:
Based on the analysis of technical indicators, the stock price of URTH is likely to experience a short-term pullback or consolidation in the upcoming days. The overbought conditions indicated by momentum indicators and the upper Bollinger Band suggest a potential reversal in the short term. Traders may consider taking profits or waiting for a better entry point before considering long positions. Exercise caution and monitor the price action closely for potential opportunities.