Technical Analysis of USCA 2024-05-10
Overview:
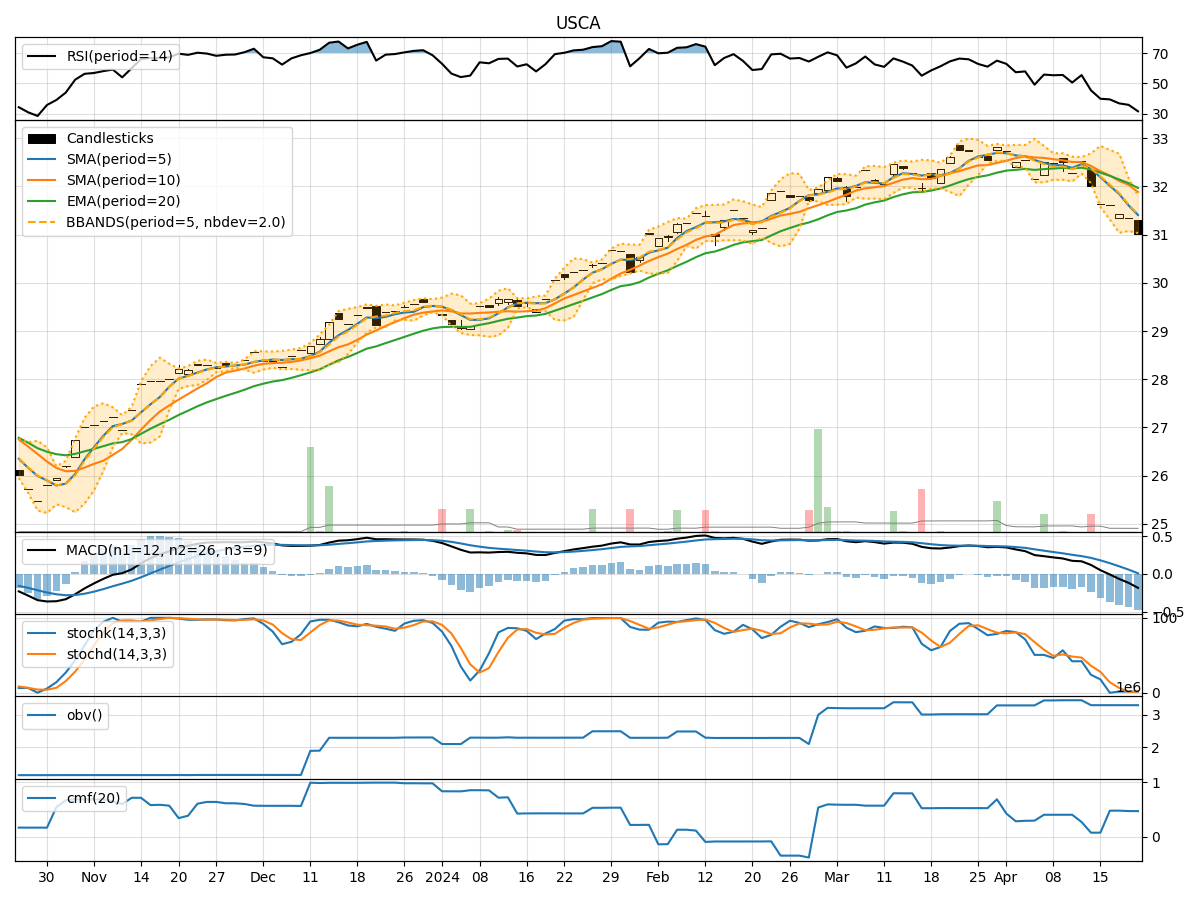
In analyzing the technical indicators for USCA over the last 5 days, we will delve into the trend, momentum, volatility, and volume indicators to provide a comprehensive outlook on the possible stock price movement in the coming days. By examining key metrics such as moving averages, MACD, RSI, Bollinger Bands, and OBV, we aim to offer valuable insights and predictions for potential price action.
Trend Indicators:
- Moving Averages (MA): The 5-day MA has been consistently above the 10-day SMA, indicating a short-term bullish trend.
- MACD: The MACD line has been trending upwards, crossing above the signal line, suggesting increasing bullish momentum.
- EMA: The EMA has been on an upward trajectory, reflecting a positive trend in the stock price.
Momentum Indicators:
- RSI: The RSI has been gradually increasing and is currently in the overbought territory, signaling potential strength in the stock.
- Stochastic Oscillator: Both %K and %D have been near 100, indicating strong buying pressure.
- Williams %R: The indicator is at 0, suggesting a potential reversal in the short term.
Volatility Indicators:
- Bollinger Bands: The stock price has been trading within the bands, with the %B indicator hovering around 0.8, indicating an uptrend.
- Volatility: The volatility has been decreasing, which could signal a period of consolidation or a potential breakout.
Volume Indicators:
- On-Balance Volume (OBV): The OBV has been relatively stable, indicating consistent buying interest in the stock.
- Chaikin Money Flow (CMF): The CMF has been negative, suggesting some distribution in the stock.
Conclusion:
Based on the analysis of the technical indicators, the stock of USCA is exhibiting strong bullish signals across various metrics. The trend indicators, momentum indicators, and volatility indicators all point towards a continued upward movement in the stock price. The increasing MA, positive MACD, overbought RSI, and strong buying pressure from the stochastic oscillator indicate a bullish outlook.
While there may be some signs of consolidation or a potential short-term reversal indicated by the Williams %R and decreasing volatility, the overall trend remains bullish. Therefore, it is likely that the stock price of USCA will continue to rise in the next few days. Traders and investors could consider buying opportunities in anticipation of further price appreciation.
It is important to monitor the indicators closely for any signs of divergence or reversal in the trend. Additionally, external factors such as market news and economic events should also be taken into consideration for a comprehensive analysis.