Technical Analysis of USCF 2024-05-10
Overview:
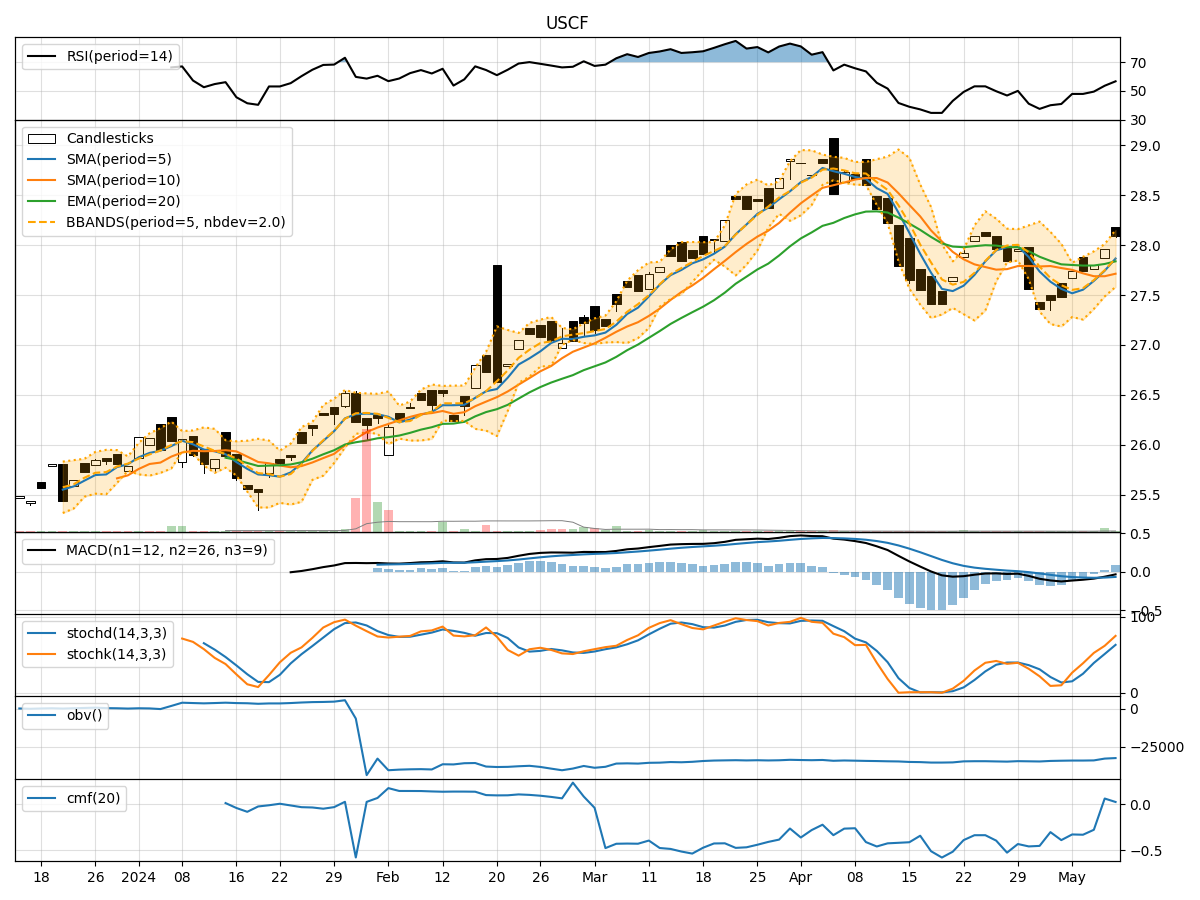
In the last 5 trading days, the stock has shown a gradual increase in closing price with fluctuating volumes. The trend indicators suggest a slightly bearish sentiment with the MACD showing negative values. Momentum indicators are showing a positive trend with increasing RSI values. Volatility indicators are relatively stable, and volume indicators show a mixed sentiment with OBV slightly increasing.
Trend Indicators:
- Moving averages (MA) are showing a slight uptrend, with the 5-day MA consistently above the 10-day SMA.
- Exponential Moving Average (EMA) is relatively flat, indicating a lack of strong trend direction.
- MACD is negative, suggesting a bearish momentum in the short term.
Momentum Indicators:
- RSI is gradually increasing, indicating strengthening momentum.
- Stochastic indicators are in the overbought region, suggesting a potential reversal or consolidation.
- Williams %R is also in the oversold region, indicating a possible reversal.
Volatility Indicators:
- Bollinger Bands are relatively narrow, indicating low volatility.
- Bands are not expanding or contracting significantly, suggesting a stable price range.
Volume Indicators:
- On-Balance Volume (OBV) is slightly increasing, indicating some accumulation.
- Chaikin Money Flow (CMF) is negative, suggesting a slight outflow of money from the stock.
Key Observations:
- Trend: The stock is in a slight uptrend but lacks strong momentum.
- Momentum: Momentum is gradually increasing, but overbought conditions may lead to a reversal.
- Volatility: Low volatility indicates a stable price range.
- Volume: Volume indicators show mixed signals, with OBV slightly increasing.
Conclusion:
Based on the analysis of technical indicators, the stock is likely to experience sideways movement in the next few days. The lack of strong bullish or bearish signals suggests a period of consolidation. Traders may expect the stock price to trade within a narrow range with limited volatility. It is advisable to closely monitor the momentum indicators for any signs of a potential trend reversal.