Technical Analysis of USDU 2024-05-10
Overview:
In analyzing the technical indicators for USDU over the last 5 days, we will delve into the trend, momentum, volatility, and volume indicators to provide a comprehensive outlook on the possible stock price movement in the coming days. By examining key metrics such as moving averages, MACD, RSI, Bollinger Bands, and OBV, we aim to offer valuable insights and recommendations for potential trading strategies.
Trend Indicators:
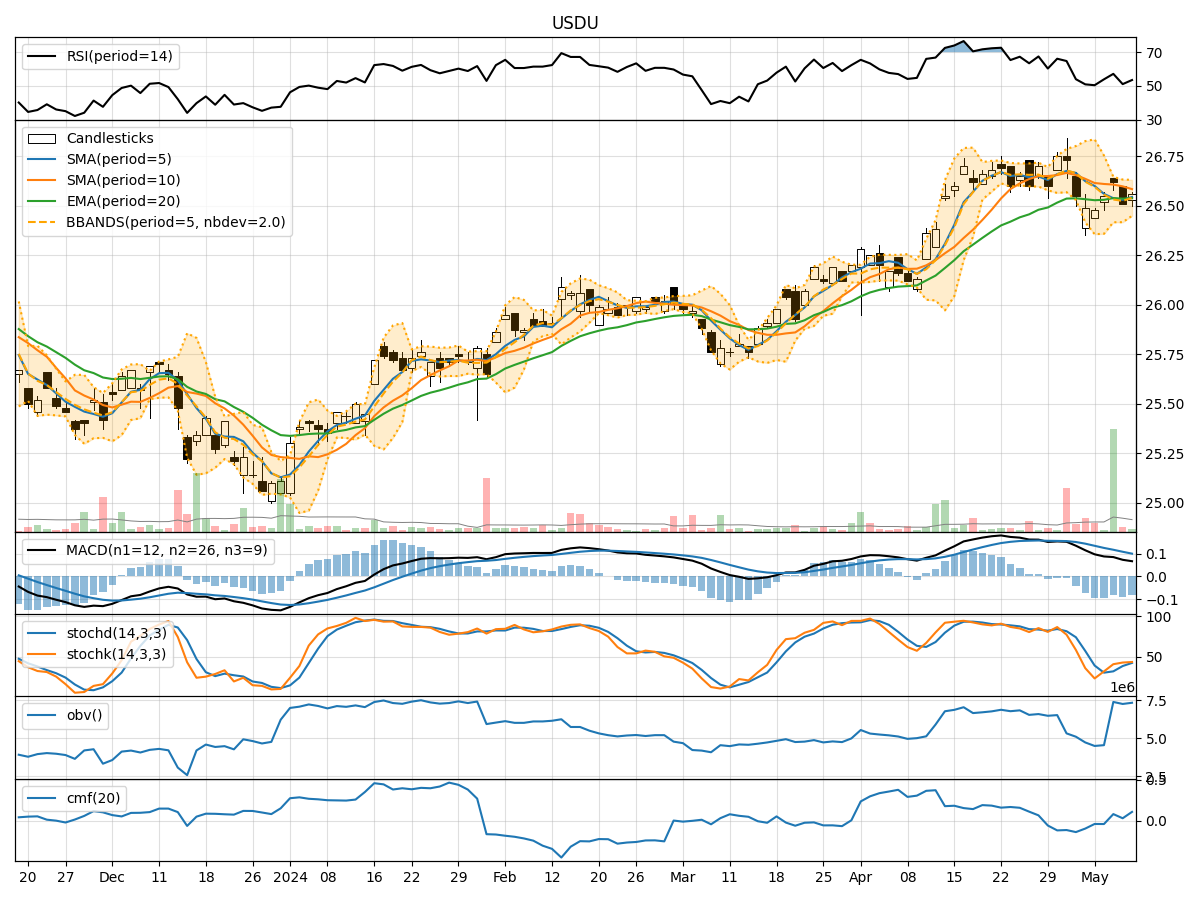
- Moving Averages (MA): The 5-day MA has been fluctuating around the closing prices, indicating short-term price trends. The SMA(10) and EMA(20) have shown slight variations but have not diverged significantly.
- MACD: The MACD line has been positive, indicating a bullish trend, although the MACD histogram has shown a slight decrease in momentum over the last few days.
Momentum Indicators:
- RSI: The RSI has been hovering around the neutral zone, suggesting a lack of strong momentum in either direction.
- Stochastic Oscillator: Both %K and %D have been fluctuating, indicating indecision in the market.
- Williams %R: The indicator has been moving between oversold and neutral levels, reflecting potential reversal points.
Volatility Indicators:
- Bollinger Bands: The bands have been relatively narrow, suggesting low volatility in the stock price movements.
- Bollinger %B: The %B indicator has been fluctuating around the midline, indicating a lack of strong trend direction.
Volume Indicators:
- On-Balance Volume (OBV): The OBV has shown mixed signals, with alternating positive and negative values, reflecting uncertainty in the buying and selling pressure.
- Chaikin Money Flow (CMF): The CMF has been oscillating around the zero line, indicating a balance between buying and selling pressure.
Key Observations and Opinions:
- Trend: The trend indicators suggest a neutral to slightly bullish sentiment in the short term.
- Momentum: Momentum indicators indicate a lack of strong momentum in either direction, signaling potential consolidation.
- Volatility: Low volatility as indicated by Bollinger Bands suggests a period of price stability.
- Volume: Mixed signals in volume indicators reflect uncertainty in market participation.
Conclusion:
Based on the analysis of the technical indicators, the next few days for USDU are likely to see sideways movement with limited volatility. The lack of strong trends in both momentum and volume, coupled with the narrow Bollinger Bands, indicates a period of consolidation. Traders may consider adopting a range-bound strategy until clearer signals emerge in the technical indicators.