Technical Analysis of USE 2024-05-10
Overview:
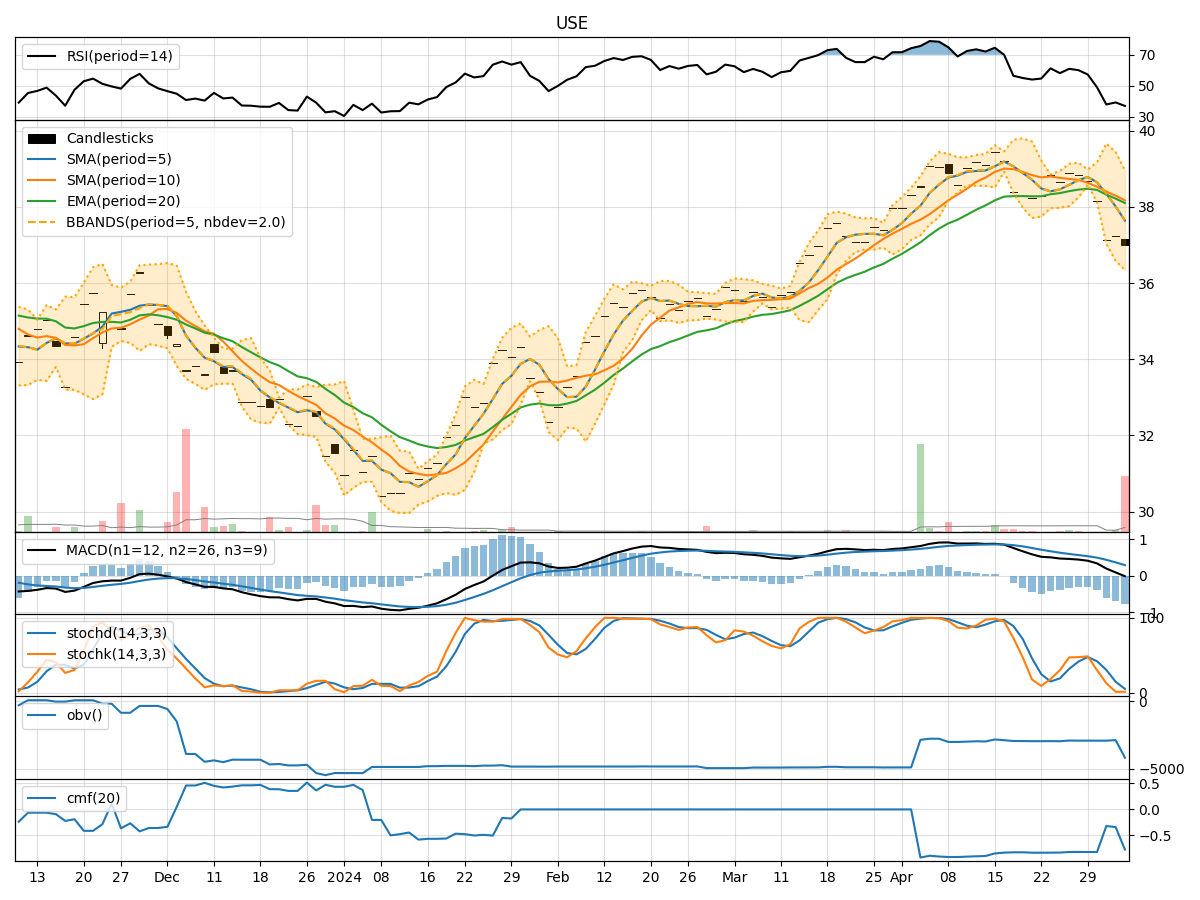
In the last 5 trading days, the stock has shown a slight decline in price from 37.26 to 36.72. Various technical indicators provide insights into the trend, momentum, volatility, and volume of the stock. By analyzing these indicators, we can make informed predictions about the possible future movement of the stock price.
Trend Analysis:
- Moving Averages (MA): The 5-day MA has been decreasing, indicating a short-term bearish trend.
- MACD: The MACD line has been consistently negative, suggesting a bearish momentum.
- RSI: The RSI is below 50, indicating a bearish sentiment in the market.
Key Observation: The trend indicators suggest a bearish outlook for the stock in the short term.
Momentum Analysis:
- Stochastic Oscillator: Both %K and %D are below 20, indicating an oversold condition.
- Williams %R: The Williams %R is at -100, signaling an extremely oversold condition.
Key Observation: Momentum indicators suggest that the stock is oversold and could potentially see a reversal in the near future.
Volatility Analysis:
- Bollinger Bands: The stock price is currently below the lower Bollinger Band, indicating oversold conditions.
- Bollinger %B: The %B is very low, suggesting that the stock is oversold.
Key Observation: Volatility indicators indicate that the stock is oversold and could potentially see a bounce back in price.
Volume Analysis:
- On-Balance Volume (OBV): The OBV has been decreasing, indicating selling pressure.
- Chaikin Money Flow (CMF): The CMF is negative, suggesting outflow of money from the stock.
Key Observation: Volume indicators show a bearish sentiment with selling pressure in the stock.
Conclusion:
Based on the analysis of trend, momentum, volatility, and volume indicators, the stock is currently in an oversold condition with a bearish outlook in the short term. However, the extreme oversold conditions indicated by momentum and volatility indicators suggest a potential reversal or bounce back in the stock price in the coming days.
Recommendation: While the short-term outlook is bearish, investors should closely monitor the stock for signs of a reversal in momentum and volume. Consider setting stop-loss levels to manage risk in case of further downside movement.