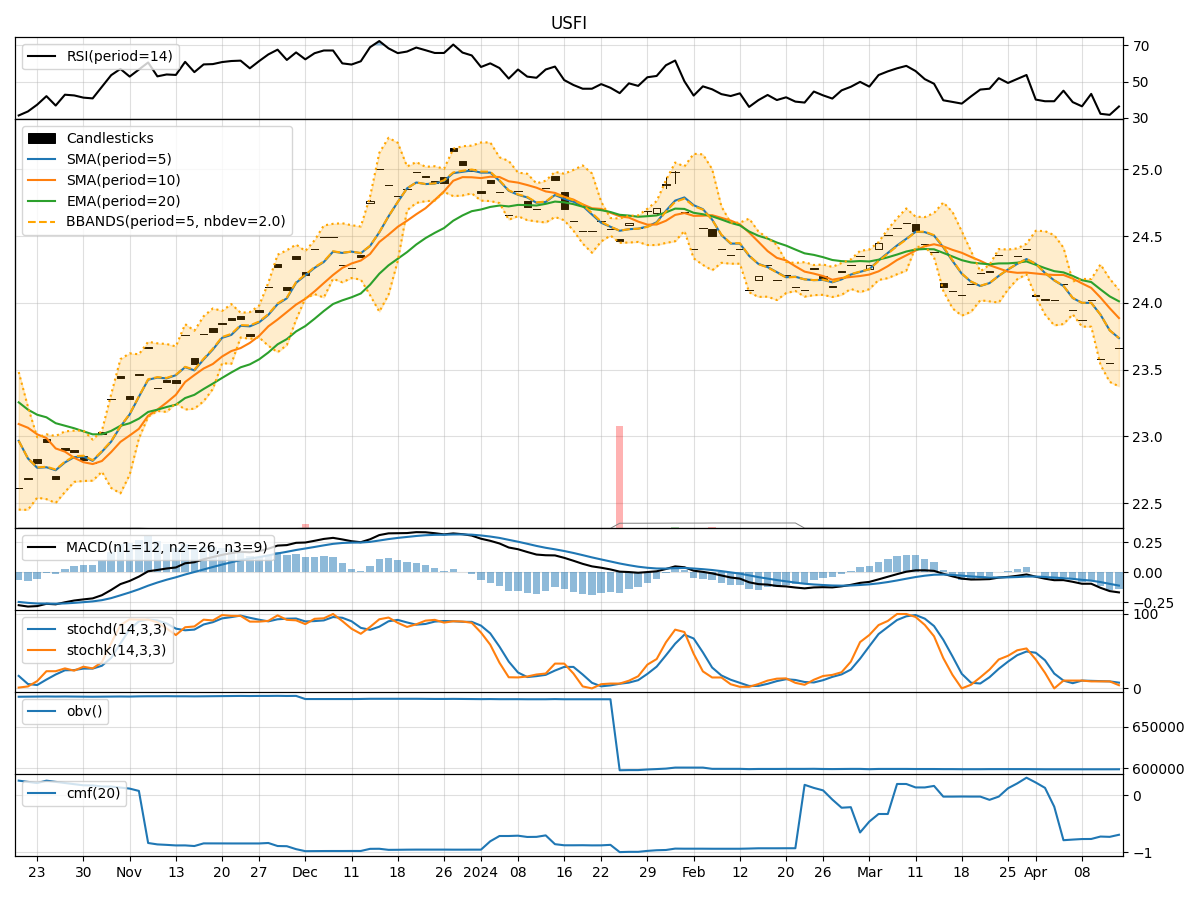
Technical Analysis of USFI 2024-05-10
Overview:
In the last 5 trading days, USFI stock has shown mixed signals across various technical indicators. The trend indicators suggest a relatively stable price movement, with the Moving Average Convergence Divergence (MACD) showing a slight positive divergence. Momentum indicators indicate a neutral to slightly bearish sentiment, while volatility indicators show a narrowing Bollinger Bands, indicating potential consolidation. Volume indicators also suggest a neutral sentiment with no significant accumulation or distribution.
Trend Indicators:
- Moving Averages (MA): The 5-day Moving Average (MA) has been relatively close to the closing price, indicating a stable trend.
- MACD: The MACD line has shown a slight positive divergence, but the MACD Histogram remains negative, suggesting a potential reversal.
- EMA: The Exponential Moving Average (EMA) has been relatively flat, indicating a lack of strong trend direction.
Momentum Indicators:
- RSI: The Relative Strength Index (RSI) is in the neutral zone, suggesting a balanced momentum between buying and selling pressure.
- Stochastic Oscillator: The Stochastic Oscillator shows a downward trend, indicating a potential bearish sentiment.
- Williams %R: The Williams %R indicator is in the oversold territory, suggesting a possible reversal in the short term.
Volatility Indicators:
- Bollinger Bands: The Bollinger Bands are narrowing, indicating decreasing volatility and a potential period of consolidation.
- Bollinger %B: The %B indicator is close to the lower band, suggesting a possible oversold condition.
Volume Indicators:
- On-Balance Volume (OBV): The OBV indicator shows a slight decrease in volume, indicating a lack of strong buying or selling pressure.
- Chaikin Money Flow (CMF): The CMF is positive, suggesting a slight inflow of money into the stock.
Conclusion:
Based on the analysis of the technical indicators, the next few days for USFI stock are likely to see sideways movement with a slight bearish bias. The trend indicators suggest a stable price trend, while momentum indicators indicate a neutral to slightly bearish sentiment. Volatility indicators point towards a period of consolidation, and volume indicators show a lack of significant accumulation or distribution.
Key Points: - The stock is likely to trade within a narrow range in the near term. - Traders may consider waiting for clearer signals before taking significant positions. - Keep a close watch on the MACD for potential trend reversals.
Overall, the outlook for USFI stock is neutral with a slight bearish bias in the short term.