Technical Analysis of USG 2024-05-10
Overview:
In analyzing the technical indicators for USG stock over the last 5 days, we will delve into the trend, momentum, volatility, and volume indicators to provide a comprehensive outlook on the possible future stock price movement. By examining these key indicators, we aim to offer valuable insights and recommendations for potential investors.
Trend Analysis:
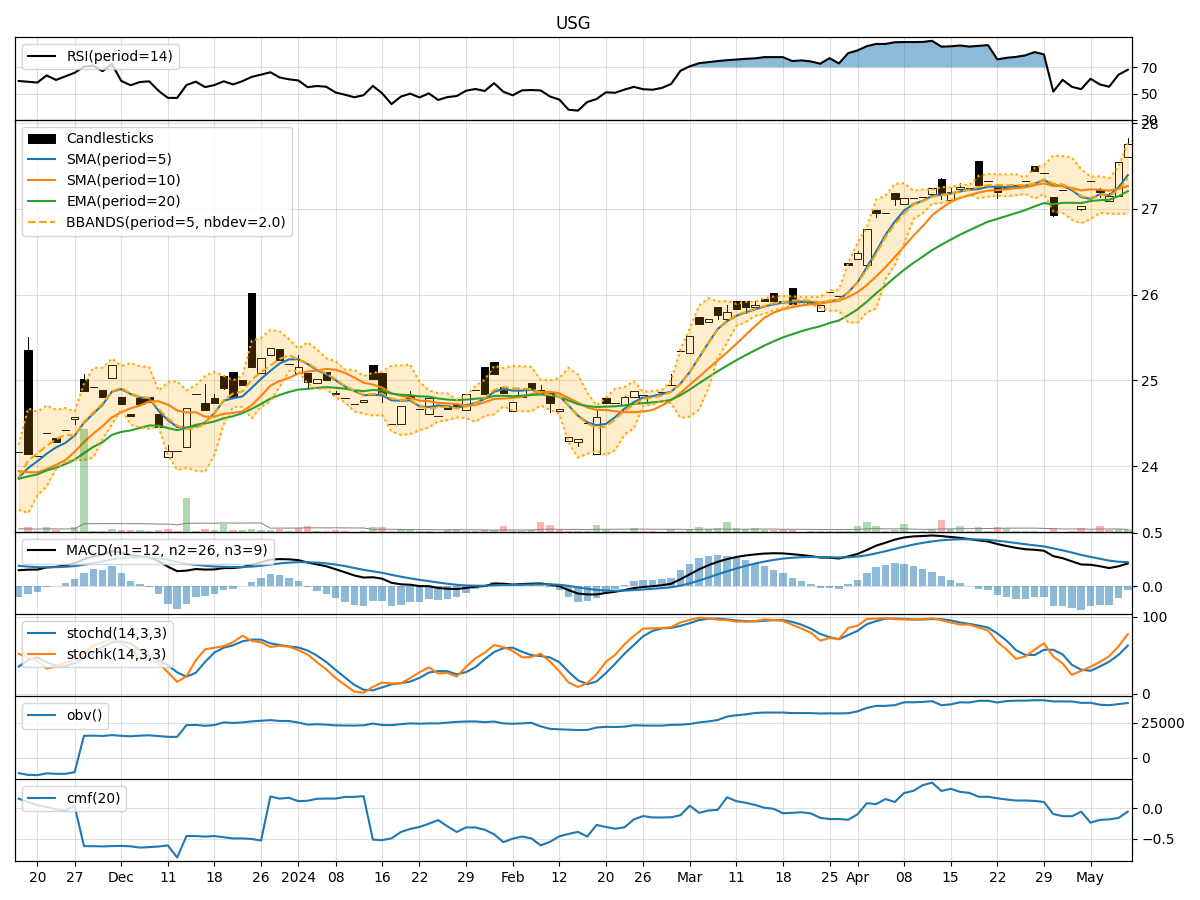
- Moving Averages (MA): The 5-day Moving Average (MA) has been consistently above the closing prices, indicating a short-term uptrend.
- MACD: The Moving Average Convergence Divergence (MACD) has shown positive values, suggesting bullish momentum.
- RSI: The Relative Strength Index (RSI) has been fluctuating around the neutral zone, indicating a balanced market sentiment.
Key Observation: The trend indicators suggest a bullish sentiment in the short term.
Momentum Analysis:
- Stochastic Oscillator: The Stochastic Oscillator has been in the overbought zone, indicating a potential reversal in the uptrend.
- Williams %R: The Williams %R has shown oversold conditions, signaling a possible buying opportunity.
Key Observation: Momentum indicators suggest a mixed sentiment with a slight bearish bias.
Volatility Analysis:
- Bollinger Bands: The Bollinger Bands have widened, indicating increased volatility in the stock price.
- Average True Range (ATR): The ATR has shown an uptick, suggesting higher price fluctuations.
Key Observation: Volatility indicators point towards increased market uncertainty.
Volume Analysis:
- On-Balance Volume (OBV): The OBV has been relatively stable, indicating a balance between buying and selling pressure.
- Chaikin Money Flow (CMF): The CMF has been negative, suggesting a net outflow of money from the stock.
Key Observation: Volume indicators reflect a neutral stance with a slight bearish bias.
Conclusion:
Based on the analysis of trend, momentum, volatility, and volume indicators, the next few days' possible stock price movement for USG is likely to be sideways with a slight bearish bias. While the trend indicators point towards a short-term bullish sentiment, the momentum indicators suggest a potential reversal in the uptrend. Additionally, increased volatility and negative volume indicators indicate a cautious market outlook.
Investors should closely monitor key support and resistance levels to gauge the stock's price action. It is advisable to exercise caution and consider implementing risk management strategies in the current market environment.