Technical Analysis of USIN 2024-05-10
Overview:
In analyzing the technical indicators for USIN over the last 5 days, we will delve into the trend, momentum, volatility, and volume indicators to provide a comprehensive outlook on the possible stock price movement. By examining these key factors, we aim to offer valuable insights and predictions for the upcoming trading days.
Trend Analysis:
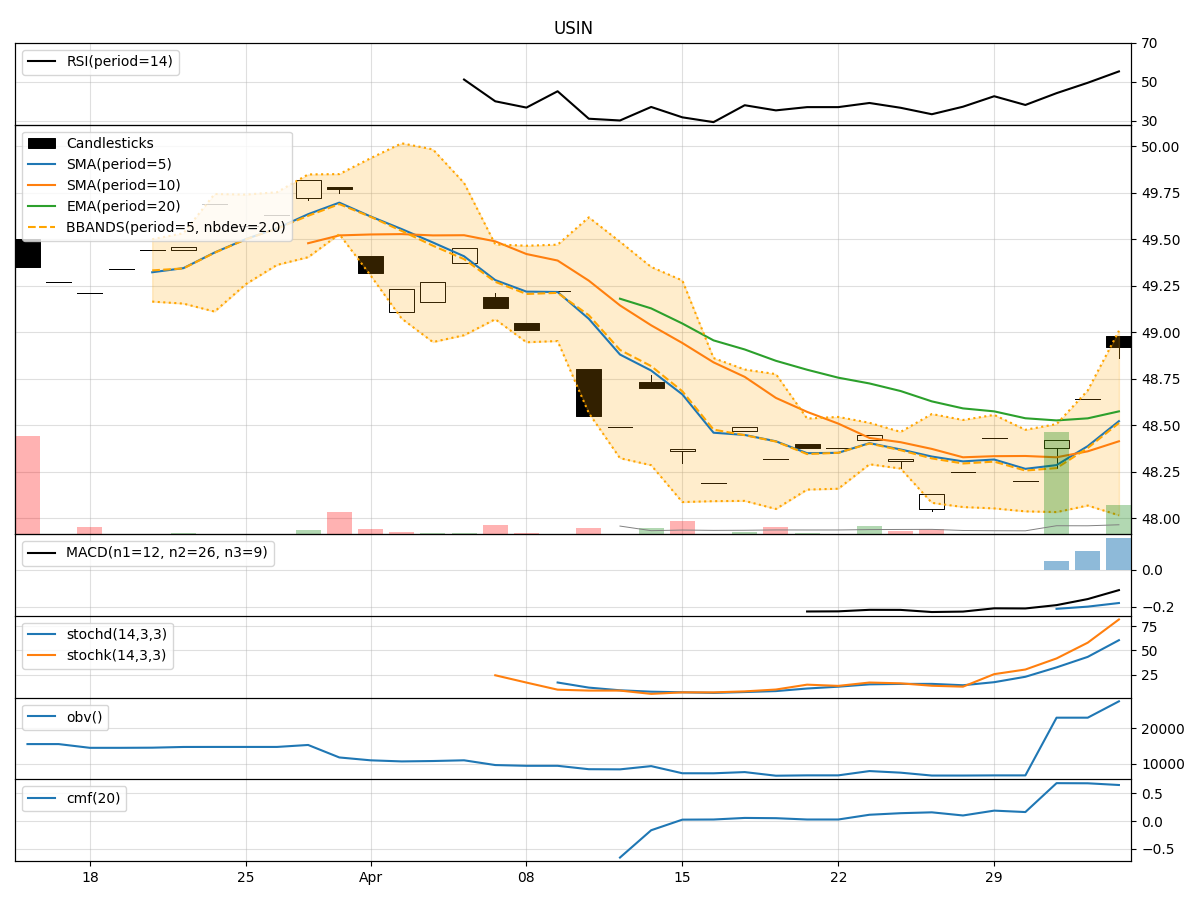
- Moving Averages (MA): The 5-day Moving Average (MA) has been consistently above the Simple Moving Average (SMA) and Exponential Moving Average (EMA), indicating a short-term uptrend.
- MACD: The Moving Average Convergence Divergence (MACD) has been negative but showing signs of convergence towards the signal line, suggesting a potential reversal in the trend.
Momentum Analysis:
- RSI: The Relative Strength Index (RSI) has been fluctuating around the neutral zone, indicating indecision in the market.
- Stochastic Oscillator: The Stochastic indicators have been gradually declining, signaling a potential bearish momentum.
Volatility Analysis:
- Bollinger Bands (BB): The Bollinger Bands have been narrowing, suggesting decreasing volatility in the stock price.
- Bollinger Band Percentage (BBP): The BBP has been decreasing, indicating a potential consolidation phase.
Volume Analysis:
- On-Balance Volume (OBV): The OBV has been relatively stable, reflecting a balanced accumulation and distribution of the stock.
- Chaikin Money Flow (CMF): The CMF has shown a slight increase, indicating a positive money flow into the stock.
Key Observations:
- The trend indicators suggest a potential reversal in the short-term uptrend.
- Momentum indicators point towards a bearish sentiment in the market.
- Volatility indicators indicate a possible consolidation phase with decreasing price fluctuations.
- Volume indicators reflect a balanced accumulation and distribution pattern.
Conclusion:
Based on the analysis of the technical indicators, the next few days' possible stock price movement for USIN is likely to be sideways with a bearish bias. Traders should exercise caution and consider implementing risk management strategies to navigate the market uncertainty. It is advisable to closely monitor key support and resistance levels for potential entry and exit points.