Technical Analysis of USL 2024-05-10
Overview:
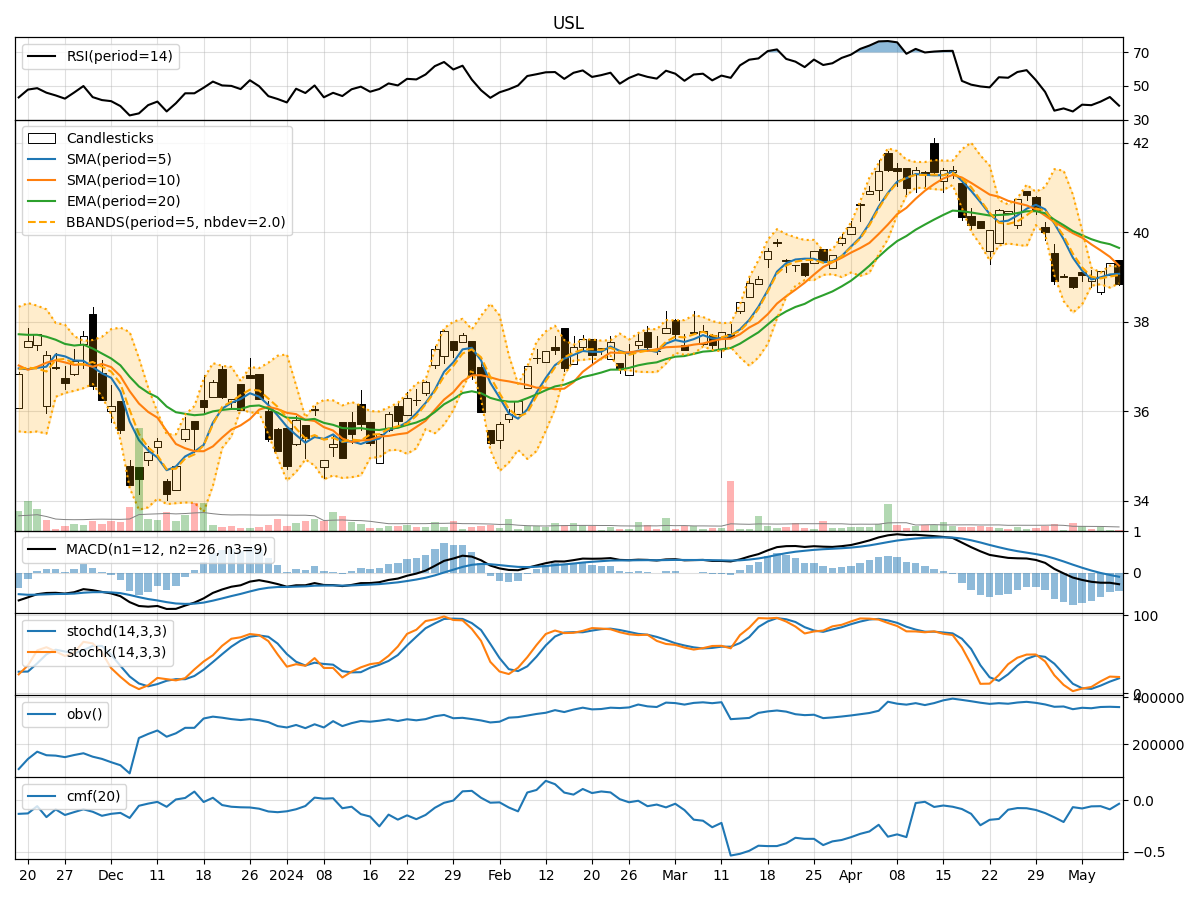
In analyzing the technical indicators for USL stock over the last 5 days, we will delve into the trend, momentum, volatility, and volume indicators to provide a comprehensive outlook on the possible future stock price movement. By examining these key indicators, we aim to offer valuable insights and recommendations for potential investors.
Trend Analysis:
- Moving Averages (MA): The 5-day Moving Average (MA) is below the Simple Moving Average (SMA) and Exponential Moving Average (EMA), indicating a short-term bearish trend.
- MACD: The MACD line is below the signal line, suggesting a bearish momentum in the stock price.
- MACD Histogram: The MACD Histogram is negative, further supporting the bearish sentiment in the market.
Momentum Analysis:
- RSI: The Relative Strength Index (RSI) is below 50, indicating a bearish momentum in the stock.
- Stochastic Oscillator: Both %K and %D lines are below 20, signaling an oversold condition in the stock.
- Williams %R: The Williams %R is below -80, indicating a potential oversold situation.
Volatility Analysis:
- Bollinger Bands (BB): The stock price is currently trading below the middle Bollinger Band, suggesting a bearish sentiment.
- Bollinger %B: The %B value is below 0.5, indicating a potential downtrend in the stock price.
Volume Analysis:
- On-Balance Volume (OBV): The OBV indicator is showing a slight decrease, reflecting a decrease in buying pressure.
- Chaikin Money Flow (CMF): The CMF is negative, indicating a bearish money flow in the stock.
Conclusion:
Based on the analysis of the technical indicators, the overall outlook for USL stock in the next few days is bearish. The trend indicators, momentum oscillators, volatility bands, and volume indicators all point towards a potential downward movement in the stock price. Investors should exercise caution and consider waiting for a more favorable entry point before considering any long positions. It is advisable to closely monitor the price action and key support levels for any signs of a potential reversal in the trend.