Technical Analysis of USMF 2024-05-10
Overview:
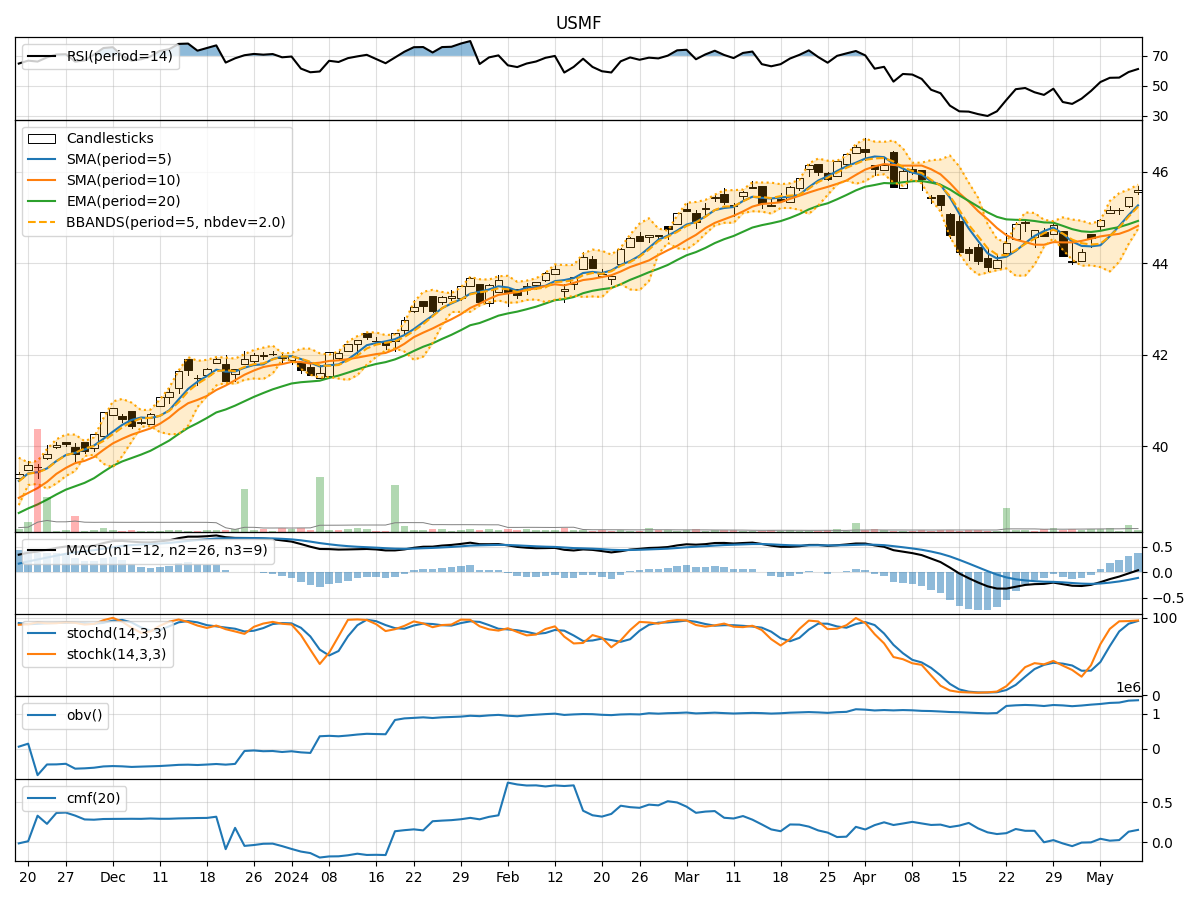
In the last 5 trading days, the stock has shown a consistent uptrend in terms of closing prices. The moving averages (MA) have been trending upwards, indicating a positive momentum. The MACD and RSI have also shown positive signs. However, the stock is currently trading near the upper Bollinger Band, suggesting a potential overbought condition. Let's delve deeper into each category of technical indicators to provide a comprehensive analysis and make a prediction for the next few days.
Trend Indicators:
- Moving Averages (MA): The 5-day MA has been consistently above the 10-day simple moving average (SMA), indicating a short-term bullish trend. The exponential moving average (EMA) has also been trending upwards, supporting the bullish sentiment.
- MACD: The MACD line has been above the signal line for the past few days, indicating a positive momentum. The MACD histogram has been increasing, suggesting strengthening bullish momentum.
Momentum Indicators:
- RSI: The Relative Strength Index (RSI) has been in the neutral to slightly overbought territory, indicating a potential for a pullback. However, it has not reached extreme levels yet.
- Stochastic Oscillator: Both %K and %D lines of the Stochastic Oscillator are in the overbought zone, suggesting a potential reversal or consolidation in the near term.
Volatility Indicators:
- Bollinger Bands (BB): The stock price is currently trading near the upper Bollinger Band, indicating a potential overbought condition. This could lead to a short-term correction or consolidation.
- Bollinger %B (BBP): The %B indicator is above 0.8, suggesting that the stock is trading at the upper end of its recent price range.
Volume Indicators:
- On-Balance Volume (OBV): The OBV has been steadily increasing over the past few days, indicating accumulation by investors. This is a positive sign for the stock.
- Chaikin Money Flow (CMF): The CMF is positive, indicating that money is flowing into the stock. This supports the bullish outlook.
Key Observations and Opinions:
- The stock is currently exhibiting strong bullish momentum based on the trend and momentum indicators.
- However, the overbought conditions indicated by the Stochastic Oscillator and Bollinger Bands suggest a potential for a short-term correction or consolidation.
- The volume indicators support the bullish trend, indicating increasing buying pressure.
Conclusion:
Based on the analysis of the technical indicators, the stock is likely to experience a short-term correction or consolidation in the next few days due to the overbought conditions highlighted by the Stochastic Oscillator and Bollinger Bands. Investors should be cautious and consider taking profits or waiting for a better entry point before initiating new positions. The overall trend remains bullish, but a period of consolidation or pullback is expected in the near term.