Technical Analysis of USML 2024-05-10
Overview:
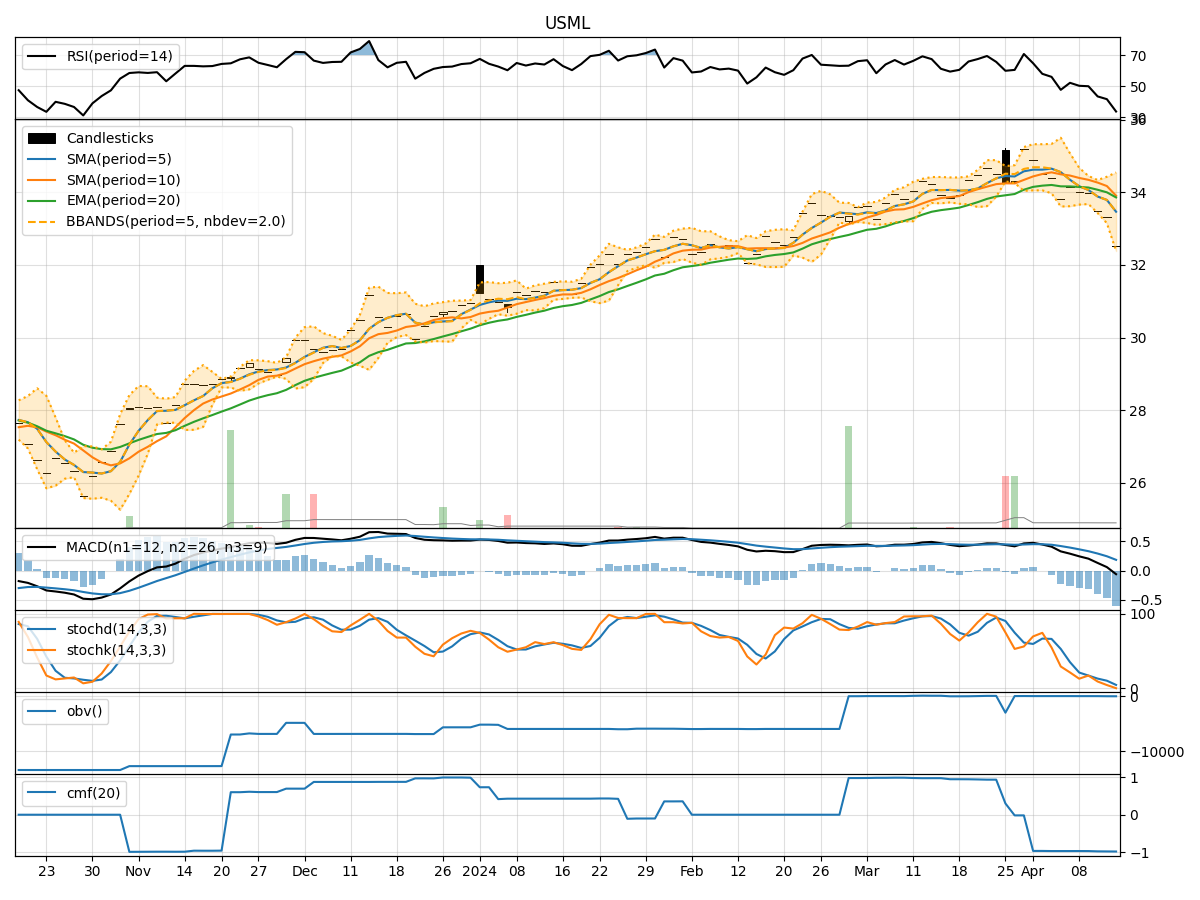
In the last 5 trading days, USML stock has shown a consistent uptrend in its price, supported by increasing volumes. The moving averages have been trending upwards, indicating a positive momentum in the stock. The MACD and RSI indicators also suggest bullish sentiment. However, the Bollinger Bands and Stochastic indicators show signs of potential overbought conditions. Let's delve deeper into each category of technical indicators to provide a comprehensive analysis and make a prediction for the next few days.
Trend Indicators:
- Moving Averages (MA): The 5-day MA has been consistently above the 10-day SMA, indicating a short-term bullish trend.
- MACD: The MACD line has been above the signal line for the past 5 days, suggesting a bullish momentum.
- EMA: The EMA has been steadily increasing, supporting the bullish trend.
Key Observation: The trend indicators point towards a continuation of the upward trend in the stock price.
Momentum Indicators:
- RSI: The RSI has been increasing and is currently in the overbought territory, indicating a strong buying momentum.
- Stochastic Oscillator: Both %K and %D have been at or near 100%, signaling a potential overbought condition.
- Williams %R: The Williams %R is at 0, indicating that the stock is trading at the highest price over the look-back period.
Key Observation: The momentum indicators suggest that the stock is overbought and may experience a short-term pullback.
Volatility Indicators:
- Bollinger Bands: The stock price has been consistently trading above the upper Bollinger Band, indicating an overextended price level.
- Bollinger %B: The %B is above 0.8, suggesting that the stock is in the overbought zone.
- Average True Range (ATR): The ATR has been relatively stable, indicating consistent volatility in the stock.
Key Observation: The volatility indicators signal a potential reversal or consolidation in the stock price.
Volume Indicators:
- On-Balance Volume (OBV): The OBV has been steadily increasing, reflecting strong buying pressure.
- Chaikin Money Flow (CMF): The CMF is positive, indicating that money is flowing into the stock.
Key Observation: The volume indicators support the bullish trend, suggesting continued buying interest in the stock.
Conclusion:
Based on the analysis of the technical indicators, it is evident that USML stock has been on a strong uptrend, supported by positive momentum and volume. However, the overbought conditions indicated by the momentum and volatility indicators suggest a potential short-term correction or consolidation in the stock price. Traders should exercise caution and consider taking profits or implementing risk management strategies in anticipation of a pullback. Short-term traders may consider taking profits, while long-term investors can hold their positions with a watchful eye on the indicators for a potential entry point.