Technical Analysis of USMV 2024-05-10
Overview:
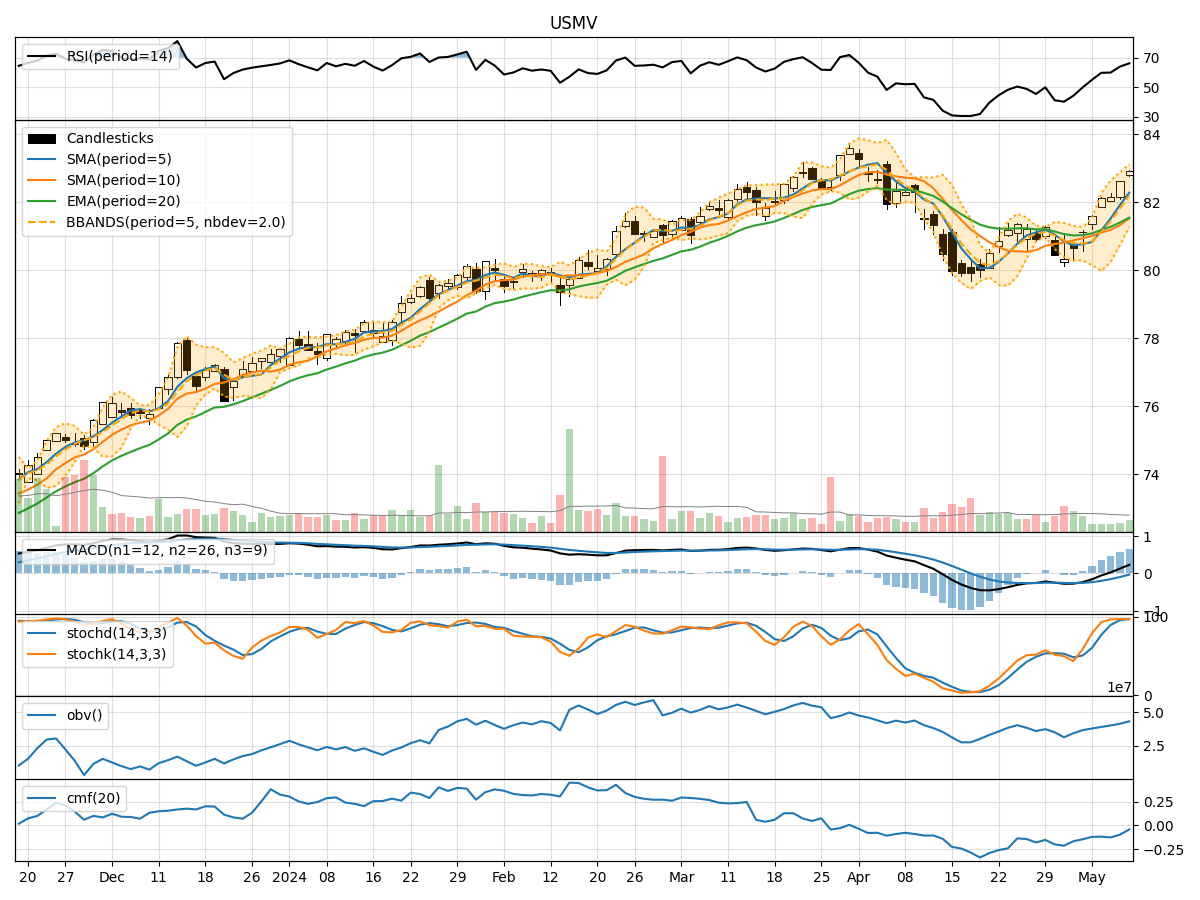
In the last 5 trading days, the USMV stock has shown a consistent uptrend in its price movement. The moving averages have been trending upwards, with the MACD indicating a strengthening bullish momentum. The RSI and Stochastic indicators are also in the overbought territory, suggesting a strong buying pressure. However, the stock is currently trading near the upper Bollinger Band, indicating a potential overbought condition.
Trend Indicators Analysis:
- Moving Averages (MA): The 5-day MA has been consistently above the longer-term SMAs, indicating a short-term bullish trend.
- MACD: The MACD line has been above the signal line for the past 5 days, indicating a bullish momentum.
- MACD Histogram: The MACD histogram has been increasing, showing a strengthening bullish momentum.
Momentum Indicators Analysis:
- RSI: The RSI has been increasing and is in the overbought zone, suggesting a strong buying pressure.
- Stochastic Oscillator: Both %K and %D lines are in the overbought region, indicating a potential reversal or consolidation.
- Williams %R: The Williams %R is also in the overbought territory, signaling a potential pullback.
Volatility Indicators Analysis:
- Bollinger Bands: The stock price is currently near the upper Bollinger Band, indicating a potential overbought condition.
- Bollinger %B: The %B is above 0.8, suggesting a potential overbought situation.
Volume Indicators Analysis:
- On-Balance Volume (OBV): The OBV has been increasing, indicating strong buying volume.
- Chaikin Money Flow (CMF): The CMF is negative, suggesting some distribution in the stock.
Key Observations:
- The stock is in a strong uptrend based on moving averages and MACD.
- Momentum indicators suggest a potential overbought condition.
- Volatility indicators point towards a potential reversal or consolidation.
- Volume indicators show mixed signals with increasing OBV but negative CMF.
Conclusion:
Based on the technical indicators and analysis: - Short-Term: The stock may experience a pullback or consolidation in the next few days due to overbought conditions indicated by momentum and volatility indicators. - Long-Term: The overall trend remains bullish, but caution is advised for short-term traders due to potential profit-taking or a correction.
Recommendation:
- Short-Term Traders: Consider taking profits or setting tight stop-loss orders to protect gains.
- Long-Term Investors: Hold positions but monitor closely for any signs of a trend reversal.
Always remember to consider risk management strategies and stay updated on market news and events that could impact the stock's price movement.