Technical Analysis of USNZ 2024-05-10
Overview:
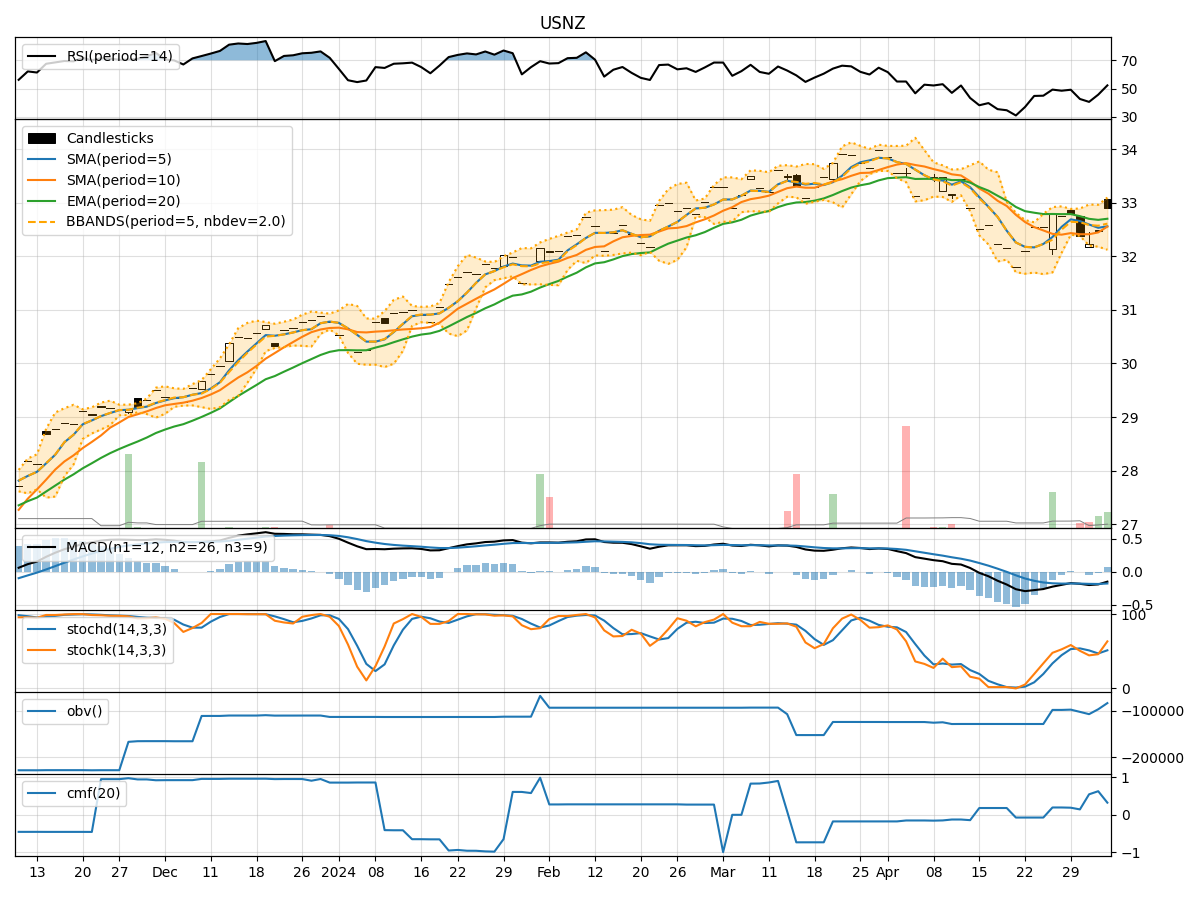
In analyzing the technical indicators for USNZ stock over the last 5 days, we will delve into the trend, momentum, volatility, and volume indicators to provide a comprehensive outlook on the possible stock price movement in the coming days. By examining these key indicators, we aim to offer valuable insights and recommendations for potential investors.
Trend Indicators:
- Moving Averages (MA): The 5-day MA has been consistently above the closing prices, indicating a short-term uptrend.
- MACD: The MACD line has been positive and increasing, suggesting bullish momentum.
- EMA: The EMA has been trending upwards, supporting the bullish sentiment.
Key Observation: The trend indicators point towards a bullish outlook for the stock.
Momentum Indicators:
- RSI: The RSI has been increasing, indicating strengthening momentum.
- Stochastic Oscillator: Both %K and %D have been at high levels, signaling overbought conditions.
- Williams %R: The indicator has been hovering around the oversold territory.
Key Observation: Momentum indicators suggest a mixed sentiment with overbought conditions.
Volatility Indicators:
- Bollinger Bands (BB): The stock price has been trading within the bands, indicating moderate volatility.
- BB Width: The width of the bands has been narrowing, suggesting a potential decrease in volatility.
Key Observation: Volatility indicators imply a stable price movement.
Volume Indicators:
- On-Balance Volume (OBV): The OBV has been relatively flat, indicating no significant divergence between price and volume.
- Chaikin Money Flow (CMF): The CMF has been positive but decreasing slightly, suggesting some selling pressure.
Key Observation: Volume indicators show a neutral stance with no clear divergence.
Conclusion:
Based on the analysis of the technical indicators, the stock is likely to experience further bullish movement in the coming days, supported by the positive trend indicators. However, the overbought conditions highlighted by momentum indicators may lead to a short-term consolidation or pullback. The stable volatility and neutral volume indicators suggest a sideways movement in the near future.
Investors should consider potential profit-taking opportunities in the short term due to the overbought conditions, while maintaining a long-term bullish outlook based on the overall trend. Monitoring key support and resistance levels along with market developments will be crucial for making informed trading decisions.
Key Recommendations:
- Short-term Traders: Consider taking profits or implementing tight stop-loss orders due to overbought conditions.
- Long-term Investors: Hold positions with a bullish bias, considering potential pullbacks as buying opportunities.
- Risk Management: Monitor key support levels and market news for any potential shifts in sentiment.
Overall, a cautious approach with a bullish bias is recommended for USNZ stock in the upcoming trading sessions.