Technical Analysis of USRD 2024-05-10
Overview:
In analyzing the technical indicators for USRD over the last 5 days, we will delve into the trend, momentum, volatility, and volume indicators to provide a comprehensive outlook on the possible stock price movement in the coming days. By examining these key aspects, we aim to offer valuable insights and predictions for potential investors.
Trend Indicators:
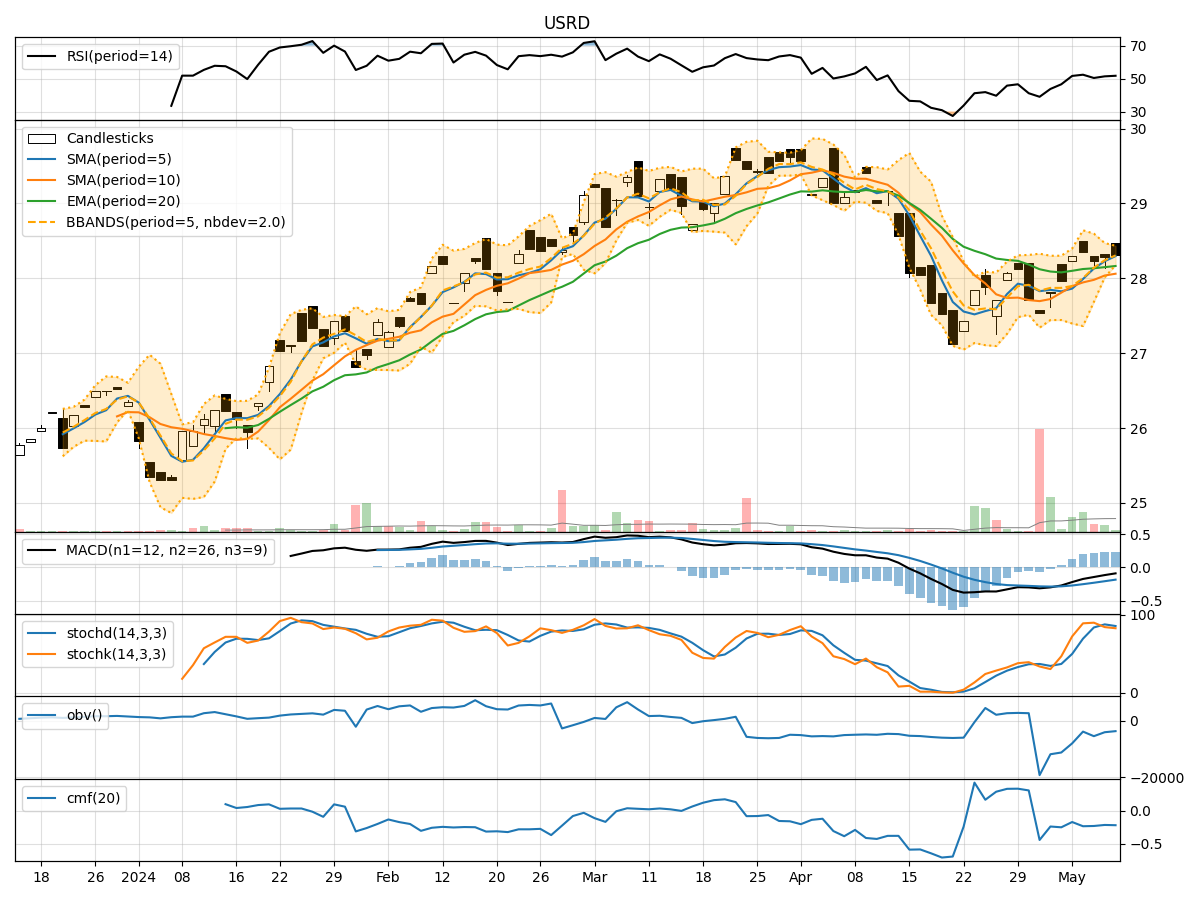
- Moving Averages (MA): The 5-day MA has been consistently above the closing prices, indicating a short-term uptrend.
- MACD: The MACD line has been negative but showing signs of convergence towards the signal line, suggesting a potential reversal.
- RSI: The RSI has been fluctuating around the neutral zone, indicating indecision in the market sentiment.
Momentum Indicators:
- Stochastic Oscillator: The stochastic indicators have been in the overbought region, signaling a potential reversal or consolidation.
- Williams %R: The Williams %R has been hovering around oversold levels, indicating a possible buying opportunity.
Volatility Indicators:
- Bollinger Bands: The narrowing of the Bollinger Bands suggests decreasing volatility and a potential breakout in the near future.
- Average True Range (ATR): The ATR has been relatively stable, indicating a lack of significant price movements.
Volume Indicators:
- On-Balance Volume (OBV): The OBV has been negative, indicating distribution rather than accumulation.
- Chaikin Money Flow (CMF): The CMF has been consistently negative, reflecting selling pressure in the market.
Key Observations:
- The trend indicators show a mixed signal with a slight bullish bias.
- Momentum indicators suggest a possible reversal or consolidation in the short term.
- Volatility indicators point towards a potential breakout due to decreasing volatility.
- Volume indicators indicate selling pressure and lack of significant accumulation.
Conclusion:
Based on the analysis of the technical indicators, the next few days' possible stock price movement for USRD is sideways consolidation with a slight bullish bias. Traders should closely monitor the trendline support and resistance levels for potential breakout opportunities. It is advisable to wait for confirmation from key indicators before making any significant trading decisions.