Technical Analysis of USRT 2024-05-10
Overview:
In analyzing the technical indicators for USRT over the last 5 days, we will delve into the trend, momentum, volatility, and volume indicators to provide a comprehensive outlook on the possible stock price movement in the coming days. By examining these key indicators, we aim to offer valuable insights and recommendations for potential investors.
Trend Analysis:
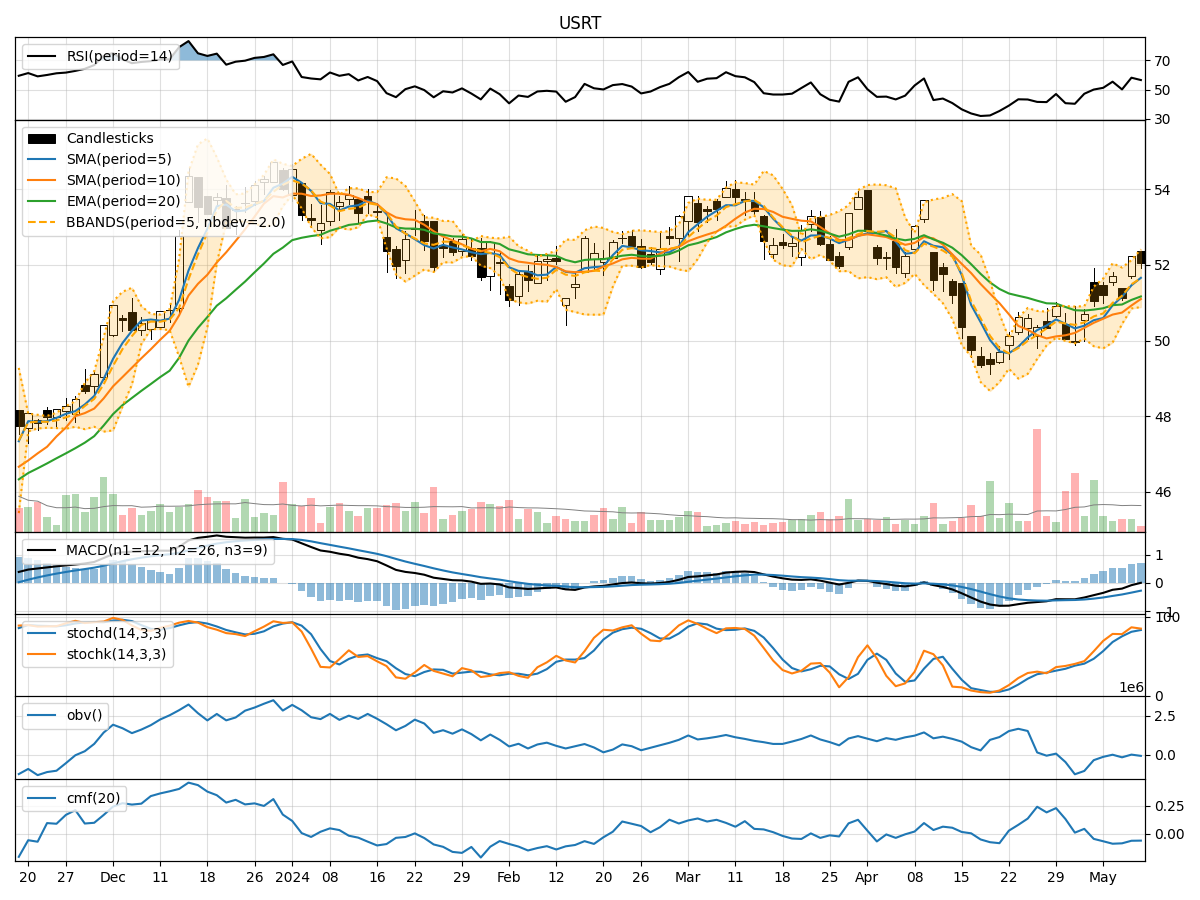
- Moving Averages (MA): The 5-day Moving Average (MA) has been consistently above the Simple Moving Average (SMA) and Exponential Moving Average (EMA), indicating a bullish trend.
- MACD: The MACD line has been above the signal line for the past few days, suggesting a bullish momentum.
Momentum Analysis:
- RSI: The Relative Strength Index (RSI) has been fluctuating but generally staying within the neutral to overbought territory, indicating a mixed sentiment.
- Stochastic Oscillator: Both %K and %D have been in the overbought zone, suggesting a potential reversal or consolidation.
Volatility Analysis:
- Bollinger Bands (BB): The stock price has been trading within the Bollinger Bands, with the bands widening slightly, indicating increased volatility.
Volume Analysis:
- On-Balance Volume (OBV): The OBV has shown mixed signals, with some days seeing selling pressure and others showing accumulation.
- Chaikin Money Flow (CMF): The CMF has been negative, indicating a bearish money flow.
Key Observations:
- The trend indicators suggest a bullish sentiment, supported by the moving averages and MACD.
- Momentum indicators show a mixed sentiment, with RSI fluctuating and stochastic oscillators in the overbought zone.
- Volatility has increased slightly, as seen in the widening Bollinger Bands.
- Volume indicators reflect mixed signals, with OBV showing selling pressure and CMF indicating a bearish money flow.
Conclusion:
Based on the analysis of the technical indicators, the next few days' possible stock price movement for USRT is likely to be bullish in the short term. The trend indicators support a bullish sentiment, while momentum indicators show a mixed sentiment that may lead to a potential consolidation or minor pullback before resuming the uptrend. Increased volatility suggests potential price swings, and the volume indicators indicate a mixed market sentiment with both buying and selling pressure.
Recommendation:
Considering the overall bullish outlook supported by the trend indicators, investors may consider buying opportunities on potential dips or consolidations for USRT in the coming days. However, it is essential to monitor the momentum indicators closely for any signs of a trend reversal or extended consolidation. As always, risk management and thorough analysis are crucial when making investment decisions in the stock market.