Technical Analysis of USSG 2024-05-10
Overview:
In analyzing the technical indicators for USSG stock over the last 5 days, we will delve into the trend, momentum, volatility, and volume indicators to provide a comprehensive outlook on the possible stock price movement in the coming days. By examining these key indicators, we aim to offer valuable insights and predictions for potential investors and traders.
Trend Indicators:
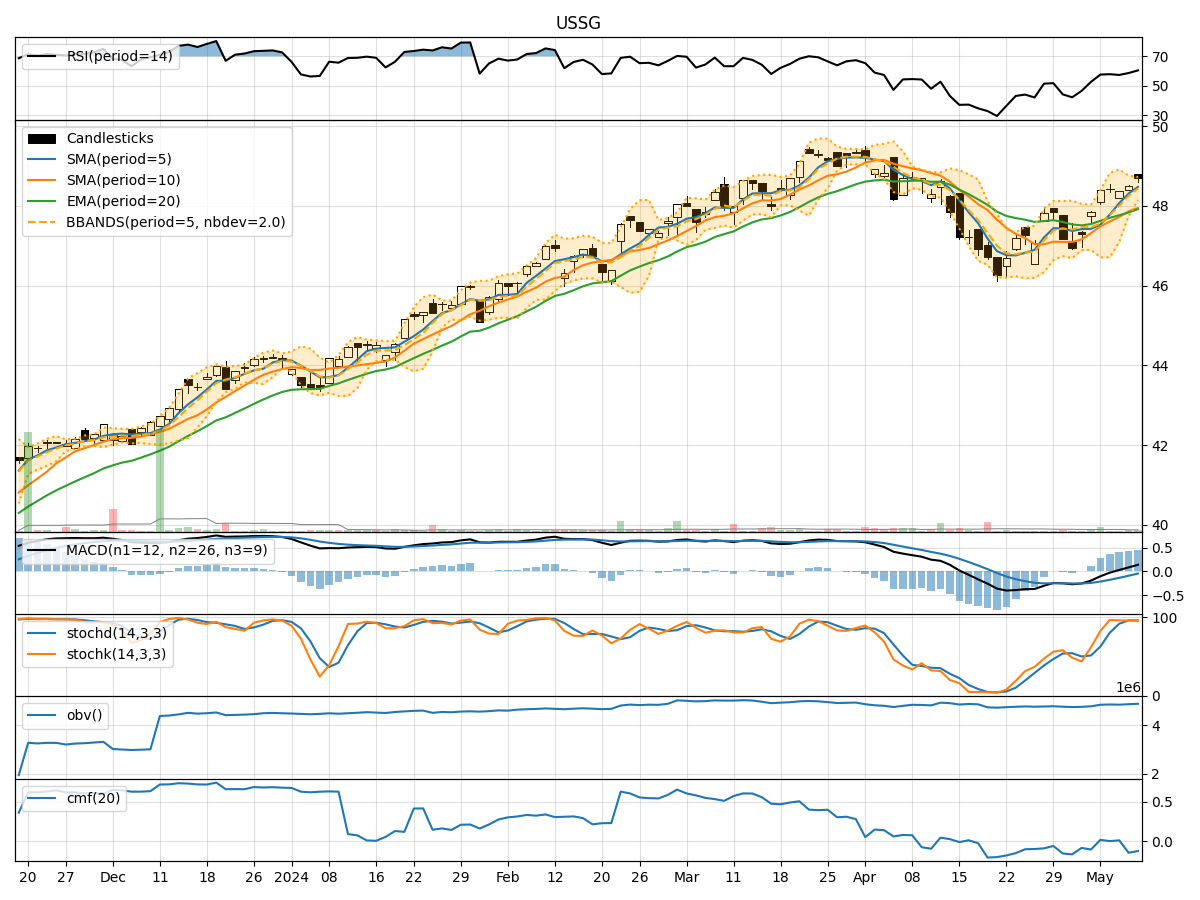
- Moving Averages (MA): The 5-day moving average has been consistently above the longer-term simple moving average (SMA) and exponential moving average (EMA), indicating a bullish trend.
- MACD: The MACD line has been consistently above the signal line, with both lines trending upwards, suggesting bullish momentum.
- MACD Histogram: The histogram has been increasing over the past 5 days, indicating strengthening bullish momentum.
Momentum Indicators:
- RSI: The Relative Strength Index (RSI) has been trending upwards and is currently in the overbought territory, suggesting a strong bullish momentum.
- Stochastic Oscillator: Both %K and %D lines of the Stochastic Oscillator are in the overbought zone, indicating a potential reversal or consolidation.
- Williams %R: The Williams %R is in the oversold territory, suggesting a potential reversal to the upside.
Volatility Indicators:
- Bollinger Bands: The stock price has been trading within the upper Bollinger Band, indicating an overbought condition.
- Bollinger Band Width: The Band Width has been narrowing, suggesting a potential decrease in volatility.
- Bollinger Band %B: The %B indicator is above 0.8, indicating a potential overbought condition.
Volume Indicators:
- On-Balance Volume (OBV): The OBV has been increasing over the past 5 days, indicating accumulation by investors.
- Chaikin Money Flow (CMF): The CMF has been positive but trending downwards, suggesting some selling pressure.
Conclusion:
Based on the analysis of the technical indicators, the USSG stock is currently in a strong bullish phase, supported by the uptrend in moving averages, MACD signals, and RSI indicating strong momentum. However, the overbought conditions in the Stochastic Oscillator and Bollinger Bands suggest a potential short-term consolidation or pullback in the stock price. Investors should closely monitor the price action and key support levels for potential entry or exit points. Overall, the outlook for USSG stock remains bullish in the near term, but caution is advised due to the overbought signals in some indicators.