Technical Analysis of USTB 2024-05-10
Overview:
In analyzing the technical indicators for USTB over the last 5 days, we will delve into the trend, momentum, volatility, and volume indicators to provide a comprehensive outlook on the possible stock price movement in the coming days.
Trend Analysis:
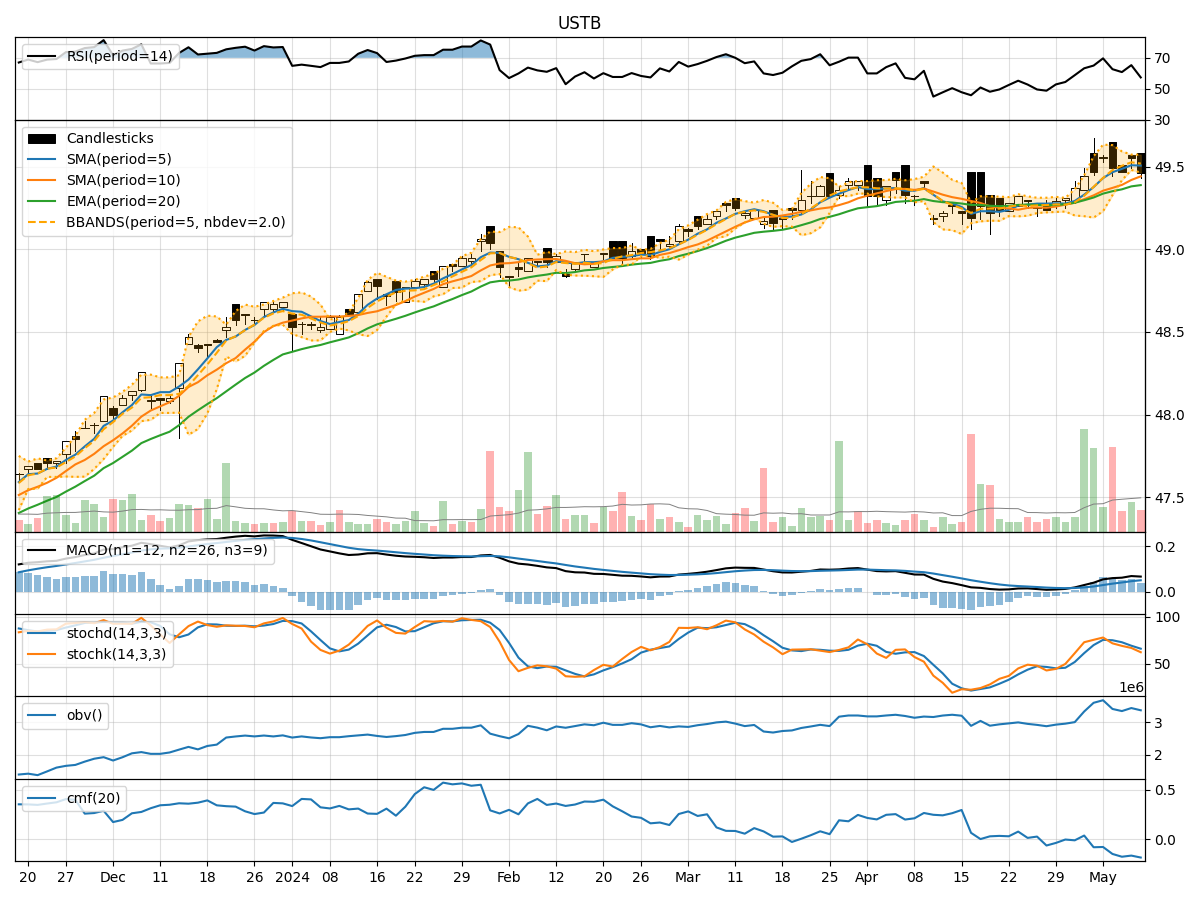
- Moving Averages (MA): The 5-day Moving Average (MA) has been consistently above the Simple Moving Average (SMA) and Exponential Moving Average (EMA), indicating a short-term uptrend.
- MACD: The MACD line has been above the signal line, with both lines showing an upward trend, suggesting bullish momentum.
- RSI: The Relative Strength Index (RSI) has been fluctuating but generally staying above 50, indicating a bullish sentiment.
Momentum Analysis:
- Stochastic Oscillator: The Stochastic Oscillator has been fluctuating in the overbought territory, suggesting a potential reversal or consolidation.
- Williams %R: The Williams %R has been moving in the oversold region, indicating a potential buying opportunity.
Volatility Analysis:
- Bollinger Bands (BB): The stock price has been trading within the Bollinger Bands, with the bands narrowing, indicating decreasing volatility.
- BB %B: The %B indicator has been fluctuating around the midline, suggesting a lack of clear direction.
Volume Analysis:
- On-Balance Volume (OBV): The OBV has been fluctuating, indicating mixed buying and selling pressure.
- Chaikin Money Flow (CMF): The CMF has been negative, suggesting a bearish sentiment in the market.
Key Observations:
- The trend indicators suggest a short-term uptrend in the stock price.
- Momentum indicators show mixed signals with potential for a reversal or consolidation.
- Volatility indicators point towards decreasing volatility in the stock.
- Volume indicators indicate mixed buying and selling pressure with a bearish sentiment.
Conclusion:
Based on the analysis of the technical indicators, the stock price of USTB is likely to experience sideways movement in the coming days. The trend is bullish in the short term, but momentum indicators suggest a potential reversal or consolidation. Volatility is decreasing, indicating a lack of significant price movements, while volume indicators show mixed signals with a bearish sentiment. Therefore, it is recommended to exercise caution and closely monitor the price action for any potential shifts in market dynamics.