Technical Analysis of USVM 2024-05-10
Overview:
In analyzing the technical indicators for USVM over the last 5 days, we will delve into the trend, momentum, volatility, and volume indicators to provide a comprehensive outlook on the possible stock price movement in the coming days. By examining these key aspects, we aim to offer valuable insights and predictions to guide investment decisions.
Trend Indicators:
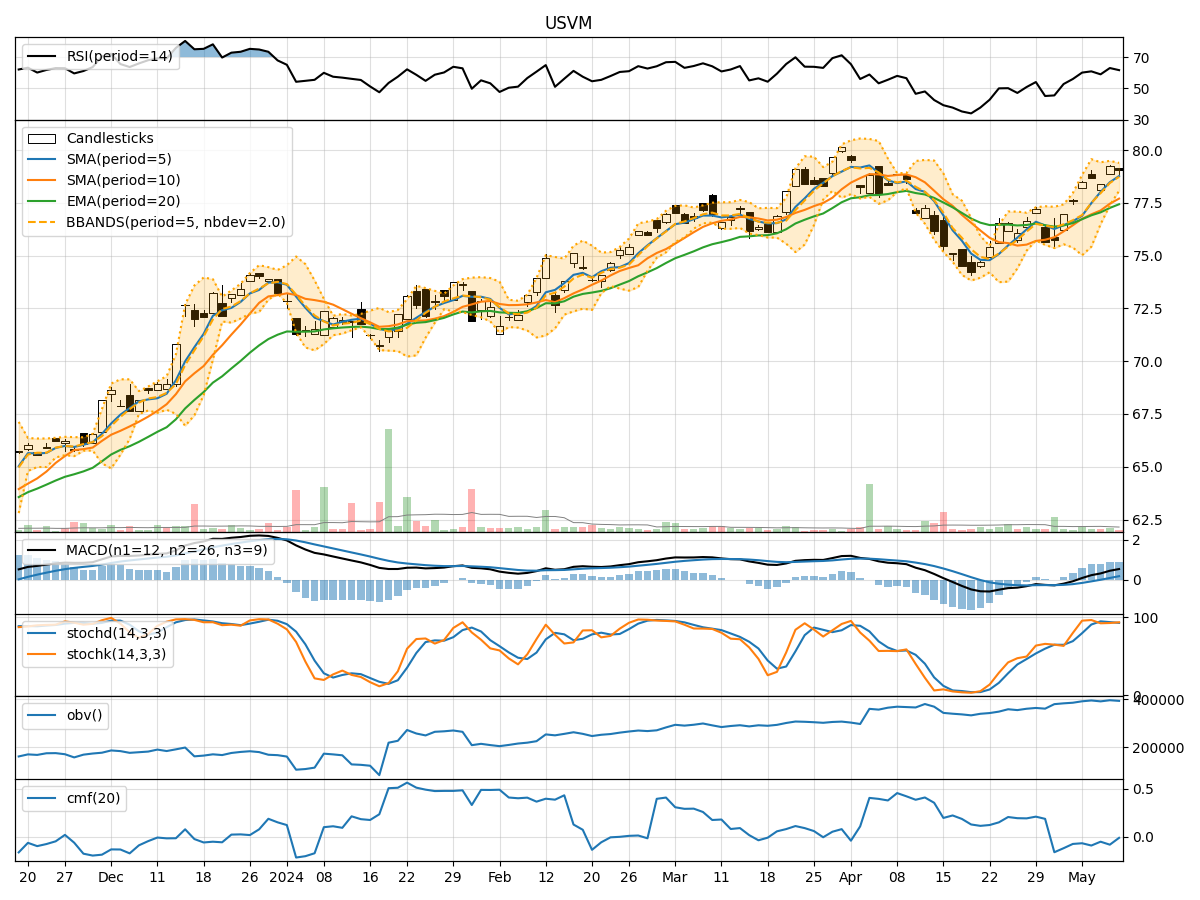
- Moving Averages (MA): The 5-day MA has been consistently above the longer-term SMAs and EMAs, indicating a bullish trend.
- MACD: The MACD line has been trending upwards, staying above the signal line, suggesting positive momentum.
- MACD Histogram: The histogram has been increasing, indicating strengthening bullish momentum.
Momentum Indicators:
- RSI: The RSI has been fluctuating around the 60 level, indicating a neutral momentum.
- Stochastic Oscillator: Both %K and %D have been relatively high, suggesting overbought conditions.
- Williams %R: The indicator has been hovering around oversold territory, signaling a potential reversal.
Volatility Indicators:
- Bollinger Bands: The stock price has been trading within the bands, showing moderate volatility.
- Bollinger %B: The %B indicator has been fluctuating around the midline, indicating a balanced market sentiment.
Volume Indicators:
- On-Balance Volume (OBV): The OBV has been relatively stable, suggesting a neutral volume trend.
- Chaikin Money Flow (CMF): The CMF has been negative, indicating outflow of money from the stock.
Key Observations:
- The trend indicators suggest a bullish sentiment with moving averages and MACD showing positive signals.
- Momentum indicators show mixed signals with RSI neutral, Stochastic overbought, and Williams %R near oversold levels.
- Volatility indicators indicate moderate price fluctuations within the Bollinger Bands.
- Volume indicators reflect neutral volume trends with OBV stable and CMF negative.
Conclusion:
Based on the analysis of the technical indicators, the stock price of USVM is likely to experience further upward movement in the coming days. The bullish trend indicated by moving averages and MACD, coupled with moderate volatility within Bollinger Bands, supports a positive outlook. However, caution is advised due to mixed signals from momentum indicators, especially the overbought Stochastic levels. Traders should monitor price action closely for potential profit-taking or trend reversal signals.