Technical Analysis of USXF 2024-05-10
Overview:
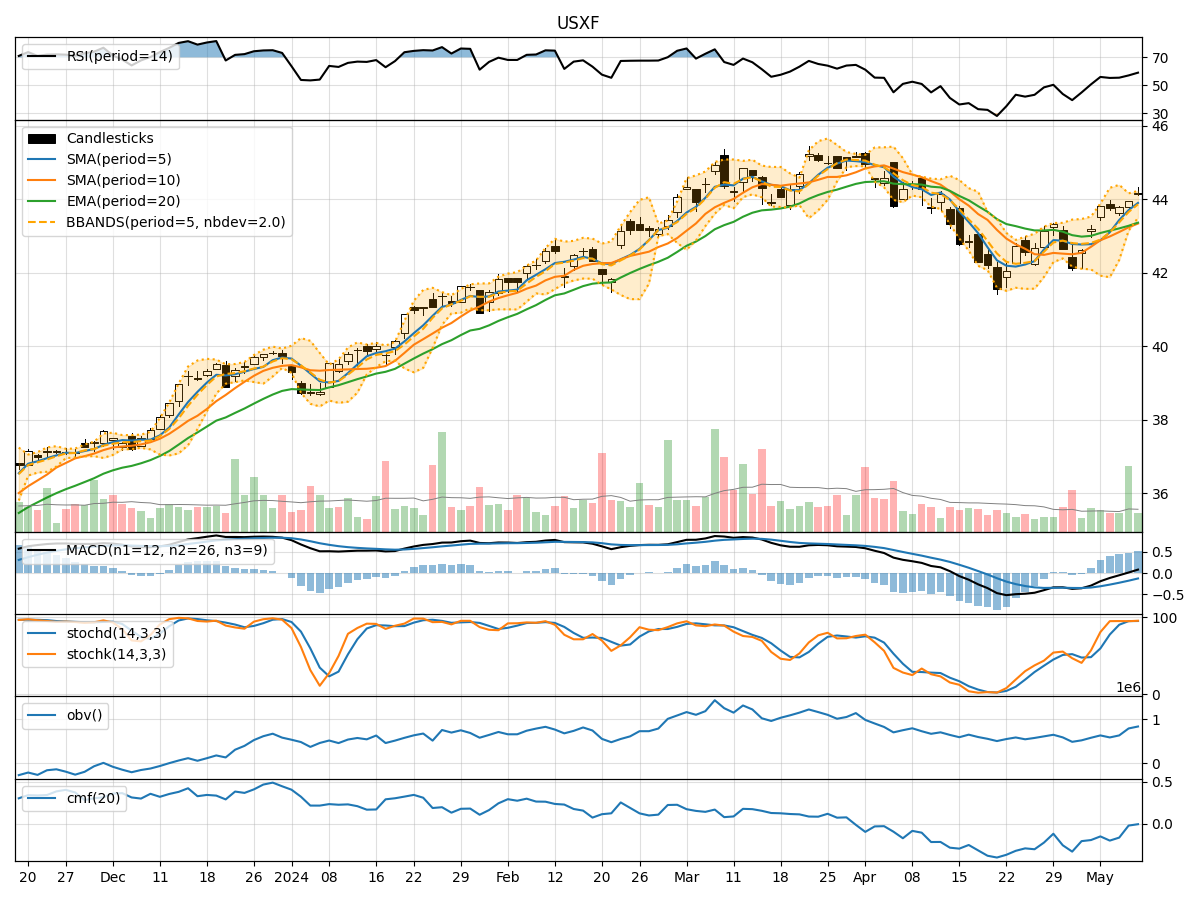
In the last 5 trading days, USXF stock has shown a mix of price movements and technical indicators. We will analyze the trend, momentum, volatility, and volume indicators to determine the possible future stock price movement.
Trend Indicators:
- Moving Averages (MA): The 5-day MA has been consistently above the 10-day SMA, indicating a short-term bullish trend.
- MACD: The MACD line has been consistently above the signal line, suggesting a bullish momentum.
- EMA: The EMA has been trending upwards, indicating a positive price trend.
Momentum Indicators:
- RSI: The RSI has been increasing, showing strengthening momentum.
- Stochastic Oscillator: Both %K and %D have been in overbought territory, indicating a potential reversal.
- Williams %R: The indicator has been fluctuating but generally in oversold territory.
Volatility Indicators:
- Bollinger Bands (BB): The bands have been narrowing, suggesting decreasing volatility.
- BB %B: The %B has been fluctuating within a narrow range, indicating stable price movement.
Volume Indicators:
- On-Balance Volume (OBV): The OBV has shown mixed signals, with some days seeing selling pressure and others showing accumulation.
- Chaikin Money Flow (CMF): The CMF has been negative, indicating a lack of buying pressure.
Key Observations:
- The trend indicators suggest a bullish sentiment in the short term.
- Momentum indicators show a mix of overbought and oversold conditions, signaling potential price reversals.
- Volatility indicators point towards decreasing price fluctuations.
- Volume indicators indicate a lack of strong buying pressure.
Conclusion:
Based on the analysis of technical indicators, the next few days for USXF stock could see sideways consolidation with a slight upward bias. Traders should watch for potential reversal signals given the overbought conditions in some momentum indicators. It is advisable to closely monitor price action and key support/resistance levels for any potential breakout or reversal signals.