Technical Analysis of UTEN 2024-05-10
Overview:
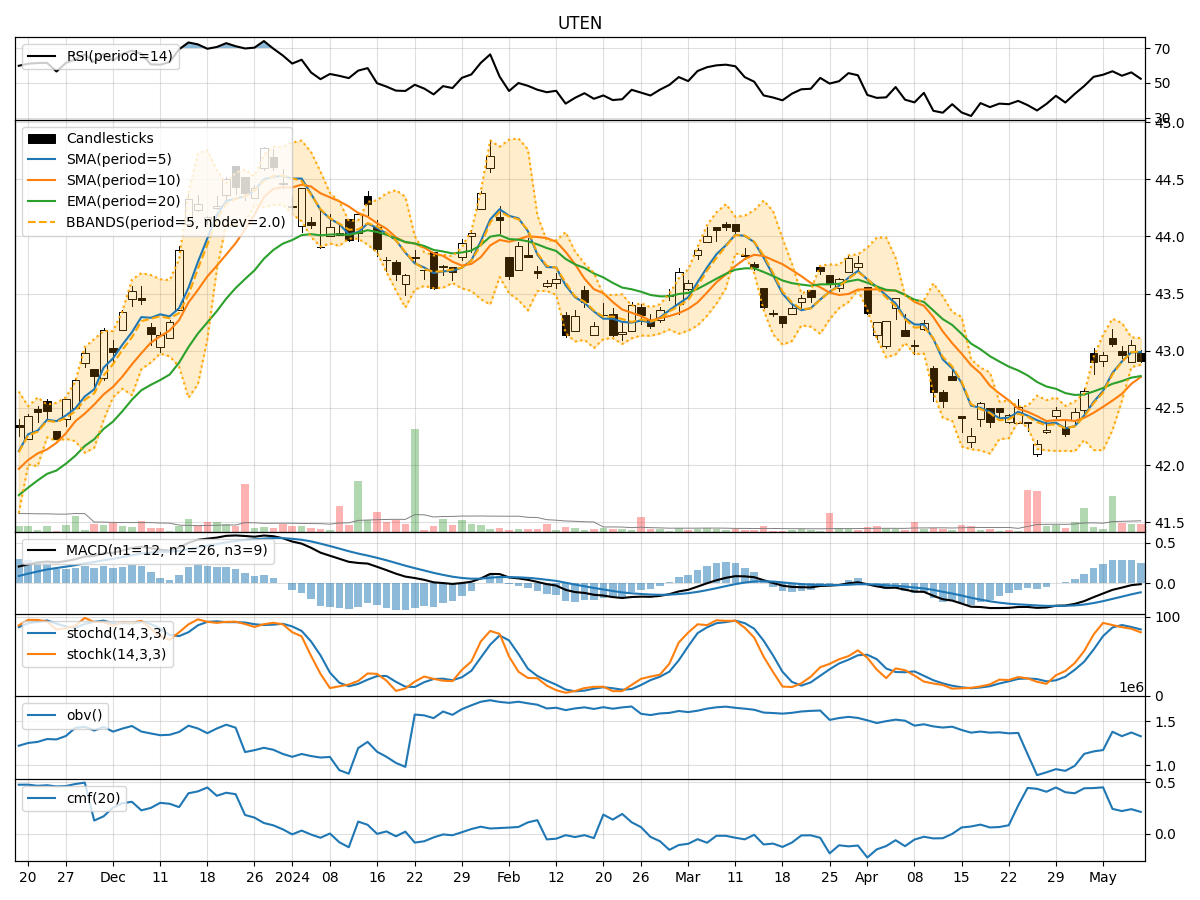
In analyzing the technical indicators for UTEN over the last 5 days, we will delve into the trend, momentum, volatility, and volume indicators to provide a comprehensive outlook on the possible stock price movement in the coming days. By examining these key aspects, we aim to offer valuable insights and predictions for potential investors.
Trend Indicators:
- Moving Averages (MA): The 5-day MA has been consistently above the 10-day SMA, indicating a short-term bullish trend.
- MACD: The MACD line has been below the signal line, suggesting a bearish momentum.
- MACD Histogram: The histogram has been decreasing, indicating a weakening bearish momentum.
Momentum Indicators:
- RSI: The RSI has been fluctuating around the neutral level of 50, suggesting a lack of strong momentum in either direction.
- Stochastic Oscillator: Both %K and %D have been declining, indicating a potential bearish momentum.
- Williams %R: The indicator has been in oversold territory, signaling a possible reversal.
Volatility Indicators:
- Bollinger Bands (BB): The stock price has been trading within the bands, showing a period of consolidation.
- Bollinger Band Width: The band width has been narrowing, indicating decreasing volatility.
Volume Indicators:
- On-Balance Volume (OBV): The OBV has been declining, suggesting selling pressure in the stock.
- Chaikin Money Flow (CMF): The CMF has been positive but decreasing, indicating a potential outflow of money from the stock.
Key Observations and Opinions:
- Trend: The short-term trend is bullish based on the moving averages, but the weakening MACD signals a potential reversal.
- Momentum: The momentum indicators are mixed, with RSI neutral, Stochastic showing bearish signals, and Williams %R in oversold territory.
- Volatility: The narrowing Bollinger Bands suggest a period of consolidation, while decreasing volatility may lead to a breakout.
- Volume: The declining OBV and decreasing CMF indicate a bearish sentiment in the stock.
Conclusion:
Based on the analysis of the technical indicators, the stock price of UTEN is likely to experience sideways movement in the coming days. The mixed signals from the trend, momentum, volatility, and volume indicators suggest a lack of clear direction. Investors should exercise caution and closely monitor the price action for any potential breakout or reversal.