Technical Analysis of UTES 2024-05-10
Overview:
In analyzing the technical indicators for UTES over the last 5 days, we will delve into the trend, momentum, volatility, and volume indicators to provide a comprehensive assessment of the stock's potential price movement. By examining these key factors, we aim to offer valuable insights and predictions for the next few days.
Trend Analysis:
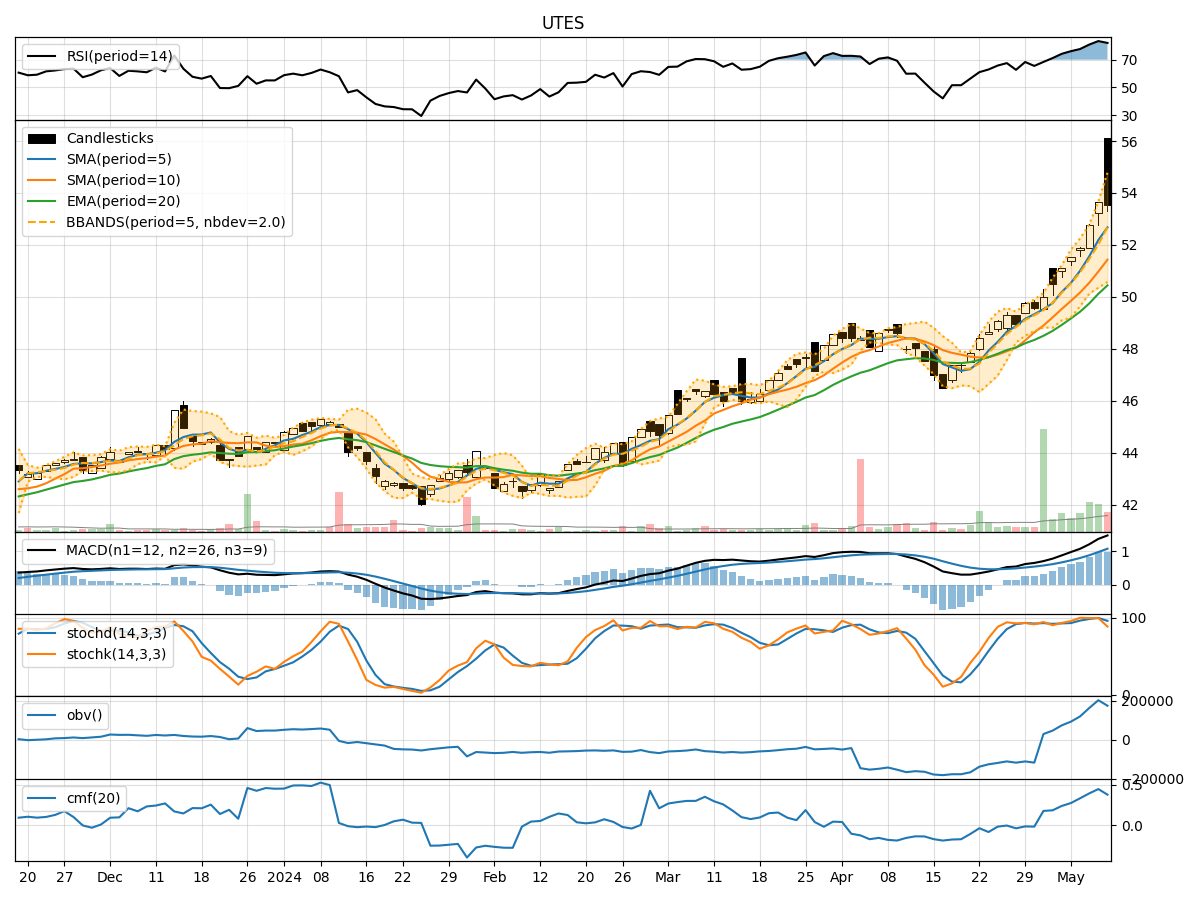
- Moving Averages (MA): The 5-day Moving Average (MA) has been consistently trending above the Simple Moving Average (SMA) and Exponential Moving Average (EMA), indicating a bullish trend.
- MACD: The Moving Average Convergence Divergence (MACD) has shown positive values, with the MACD line consistently above the Signal line, suggesting bullish momentum.
Key Observation: The trend indicators suggest a strong bullish sentiment in the stock price movement.
Momentum Analysis:
- RSI: The Relative Strength Index (RSI) has been in the overbought territory, indicating a strong buying momentum.
- Stochastic Oscillator: Both %K and %D have been in the overbought zone, signaling a potential reversal or consolidation.
- Williams %R: The Williams %R has been in the oversold region, suggesting a possible reversal in the short term.
Key Observation: Momentum indicators show conflicting signals, with RSI indicating strong buying pressure while Stochastic and Williams %R hint at a possible reversal.
Volatility Analysis:
- Bollinger Bands (BB): The stock price has been trading within the upper Bollinger Band (BBU), indicating an overbought condition.
Key Observation: Volatility indicators suggest a potential pullback or consolidation in the stock price.
Volume Analysis:
- On-Balance Volume (OBV): The OBV has been steadily increasing, reflecting strong buying volume.
- Chaikin Money Flow (CMF): The CMF has been positive, indicating a bullish money flow into the stock.
Key Observation: Volume indicators support the bullish sentiment in the stock price movement.
Conclusion:
Based on the analysis of the technical indicators, the next few days' possible stock price movement for UTES is likely to experience a pullback or consolidation. While the trend indicators signal a strong bullish sentiment, the conflicting signals from momentum indicators suggest a potential reversal or sideways movement. Additionally, the overbought condition indicated by volatility indicators and the possibility of a consolidation phase align with the potential for a short-term correction in the stock price.
Recommendation:
- Short-term Traders: Consider taking profits or implementing risk management strategies to navigate potential price fluctuations.
- Long-term Investors: Monitor the price action closely for a potential entry point during a pullback to capitalize on the overall bullish trend.
Disclaimer:
Remember that market dynamics can change rapidly, and it is essential to stay updated on the latest developments and conduct further analysis before making any investment decisions. Consulting with a financial advisor or conducting additional research is recommended to align your investment strategy with your financial goals and risk tolerance level.