Technical Analysis of UTHY 2024-05-10
Overview:
In analyzing the technical indicators for UTHY over the last 5 days, we will delve into the trend, momentum, volatility, and volume indicators to provide a comprehensive outlook on the possible stock price movement in the coming days. By examining these key aspects, we aim to offer valuable insights and predictions to guide investment decisions.
Trend Analysis:
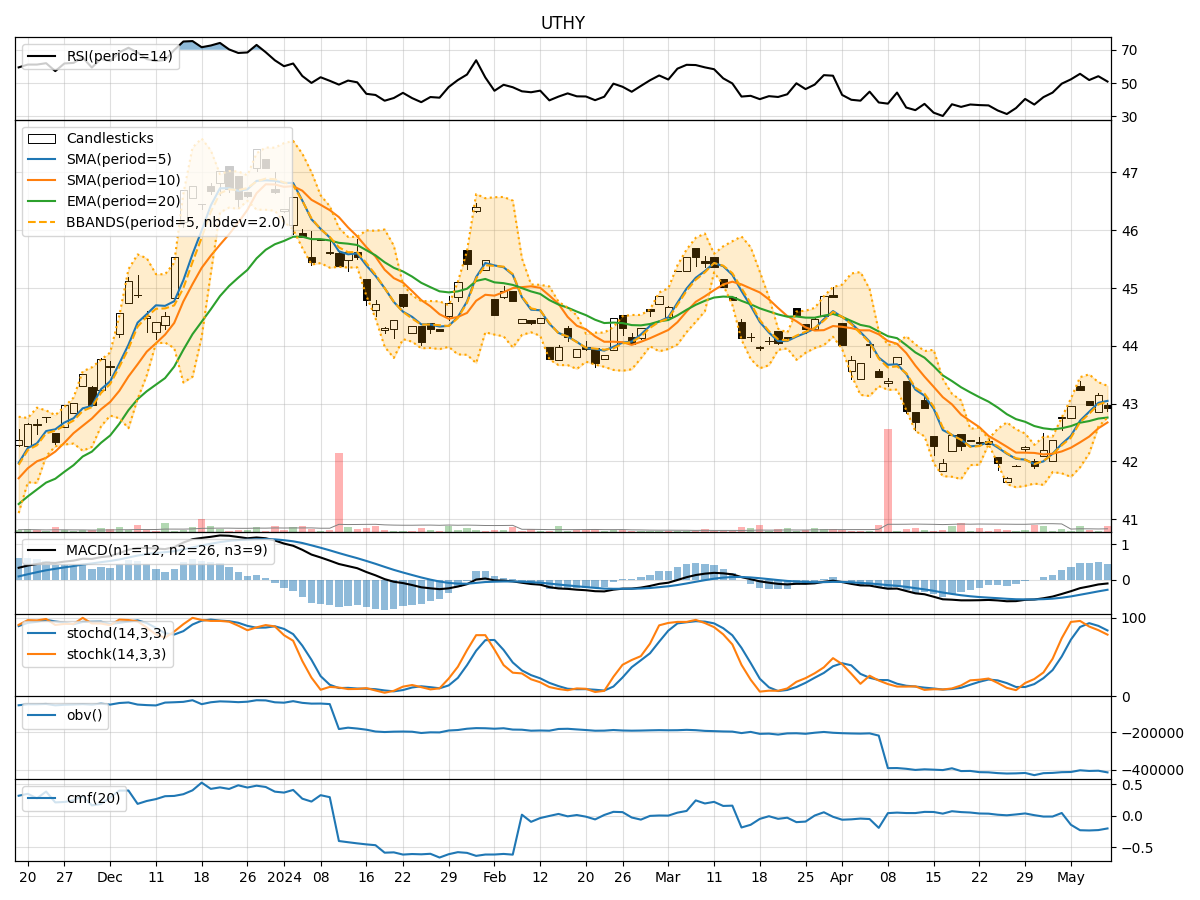
- Moving Averages (MA): The 5-day Moving Average (MA) has been consistently above the Simple Moving Average (SMA) and Exponential Moving Average (EMA), indicating a short-term uptrend.
- MACD: The Moving Average Convergence Divergence (MACD) has shown negative values but with a slight increase in the MACD Histogram (MACDH) over the period, suggesting a potential reversal in the downtrend.
Momentum Analysis:
- RSI: The Relative Strength Index (RSI) has been fluctuating around the neutral zone, indicating indecision in the market.
- Stochastic Oscillator: Both %K and %D have been declining, signaling a potential bearish momentum.
- Williams %R: The Williams %R is in the oversold territory, suggesting a possible reversal to the upside.
Volatility Analysis:
- Bollinger Bands (BB): The Bollinger Bands have been narrowing, indicating decreasing volatility in the stock price.
- Bollinger %B: The %B indicator is hovering around 0.5, suggesting a balanced market sentiment.
Volume Analysis:
- On-Balance Volume (OBV): The OBV has been negative, indicating selling pressure in the stock.
- Chaikin Money Flow (CMF): The CMF has been consistently negative, reflecting a lack of buying interest.
Key Observations:
- The trend indicators suggest a potential reversal in the short-term uptrend.
- Momentum indicators show mixed signals with a slight bearish bias.
- Volatility has been decreasing, indicating a possible period of consolidation.
- Volume indicators point towards selling pressure and a lack of buying interest.
Conclusion:
Based on the analysis of the technical indicators, the stock price of UTHY is likely to experience further downside movement in the coming days. The trend reversal signals, bearish momentum, and negative volume indicators all point towards a potential bearish outlook. Traders and investors should exercise caution and consider implementing risk management strategies in their positions.