Technical Analysis of UTSL 2024-05-10
Overview:
In analyzing the technical indicators for UTSL over the last 5 days, we will delve into the trend, momentum, volatility, and volume indicators to provide a comprehensive outlook on the possible stock price movement in the coming days. By examining these key aspects, we aim to offer valuable insights and predictions to guide investment decisions.
Trend Indicators:
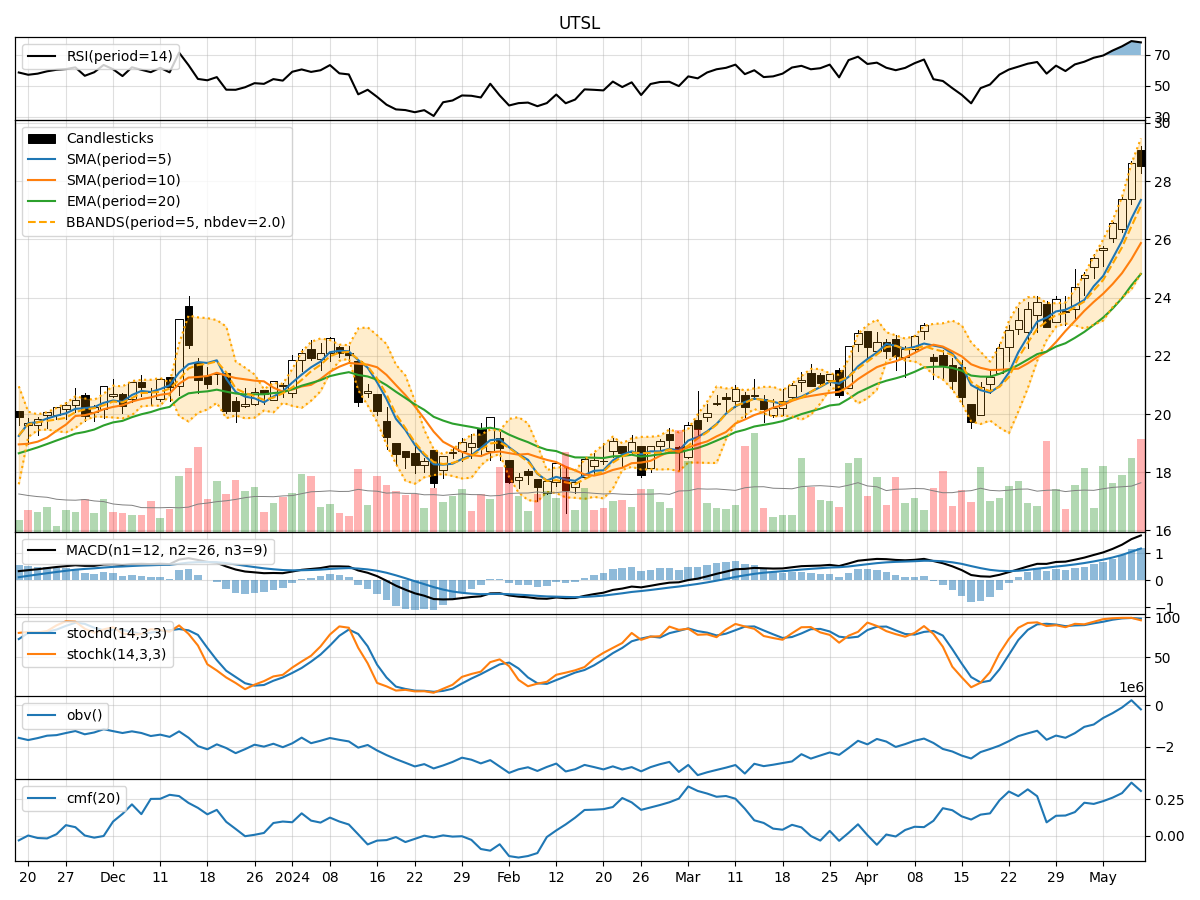
- Moving Averages (MA): The 5-day MA has been consistently above the longer-term SMAs and EMAs, indicating a strong uptrend.
- MACD: The MACD line has been consistently above the signal line, with increasing values, suggesting bullish momentum.
Momentum Indicators:
- RSI: The RSI has been trending upwards, indicating increasing buying pressure and potential overbought conditions.
- Stochastic Oscillator: Both %K and %D have been in the overbought zone, signaling a strong bullish momentum.
Volatility Indicators:
- Bollinger Bands: The stock price has been consistently trading above the middle Bollinger Band, indicating an uptrend with moderate volatility.
Volume Indicators:
- On-Balance Volume (OBV): The OBV has been steadily increasing, reflecting strong buying interest and accumulation.
- Chaikin Money Flow (CMF): The CMF has been positive, indicating that money is flowing into the stock.
Key Observations and Opinions:
- Trend: The stock is in a strong uptrend, supported by moving averages and MACD.
- Momentum: The momentum indicators suggest strong bullish momentum, but caution is advised due to potential overbought conditions.
- Volatility: The stock is experiencing moderate volatility within an uptrend, as indicated by Bollinger Bands.
- Volume: The increasing OBV and positive CMF indicate strong buying interest and accumulation.
Conclusion:
Based on the analysis of the technical indicators, the next few days' possible stock price movement for UTSL is likely to continue upwards. The strong uptrend, bullish momentum, positive volume indicators, and moderate volatility all point towards further price appreciation. However, investors should monitor for potential overbought conditions and consider implementing risk management strategies to navigate market fluctuations.