Technical Analysis of UTWO 2024-05-10
Overview:
In analyzing the technical indicators for UTWO over the last 5 days, we will delve into the trend, momentum, volatility, and volume indicators to provide a comprehensive outlook on the possible stock price movement in the coming days.
Trend Analysis:
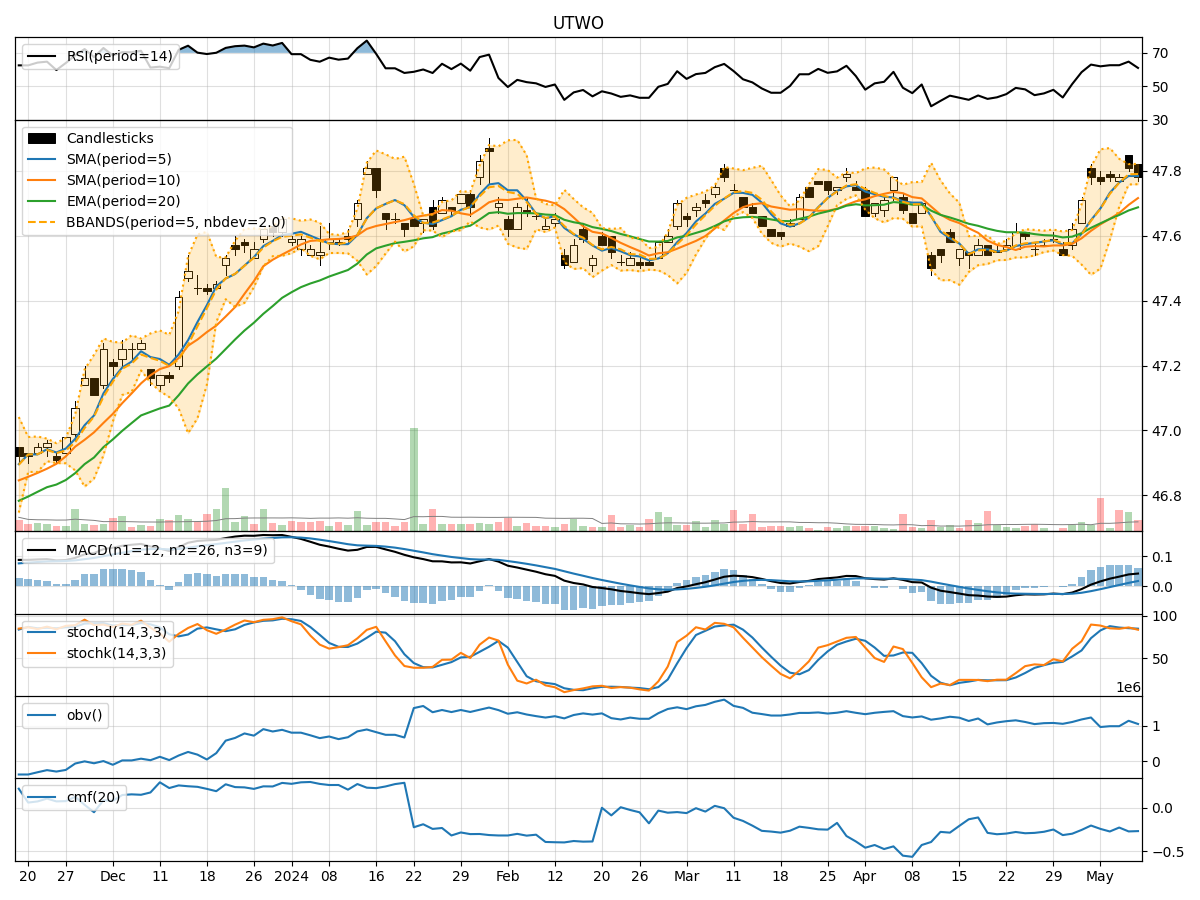
- Moving Averages (MA): The 5-day Moving Average (MA) has been consistently above the Simple Moving Average (SMA) and Exponential Moving Average (EMA), indicating a bullish trend.
- MACD: The MACD line has been consistently above the signal line, with both lines showing an upward trend, suggesting bullish momentum.
- MACD Histogram: The MACD Histogram has been increasing over the past few days, indicating strengthening bullish momentum.
Momentum Analysis:
- RSI: The Relative Strength Index (RSI) has been in the range of 60-65, indicating a neutral to slightly bullish momentum.
- Stochastic Oscillator: Both %K and %D lines of the Stochastic Oscillator have been above 80, suggesting an overbought condition.
- Williams %R: The Williams %R has been fluctuating around -20, also indicating an overbought condition.
Volatility Analysis:
- Bollinger Bands (BB): The stock price has been trading within the upper Bollinger Band (BBU), indicating an overbought condition.
- Bollinger Band Width (BBW): The Bollinger Band Width has been narrowing, suggesting a decrease in volatility.
- Bollinger Band %B (BBP): The %B indicator has been above 0.5, indicating an overbought condition.
Volume Analysis:
- On-Balance Volume (OBV): The OBV has shown mixed signals, with some days experiencing selling pressure and others showing accumulation.
- Chaikin Money Flow (CMF): The CMF has been negative, indicating a bearish money flow trend.
Conclusion:
Based on the analysis of the technical indicators, the next few days' possible stock price movement for UTWO is likely to experience a pullback or consolidation. The stock has been in an overbought condition based on the Stochastic Oscillator, Williams %R, and Bollinger Bands. The RSI suggests a neutral to slightly bullish momentum, while the CMF indicates a bearish money flow trend.
Considering these factors, it is advisable to exercise caution in entering new long positions at the current levels. Traders may consider taking profits on existing positions or implementing risk management strategies to protect against a potential downside risk. Overall, the outlook for UTWO in the short term leans towards a sideways movement or a minor correction before potentially resuming its bullish trend.
It is essential to monitor the price action closely and reassess the technical indicators as new data becomes available to adapt to any changes in market dynamics.