Technical Analysis of UTWY 2024-05-10
Overview:
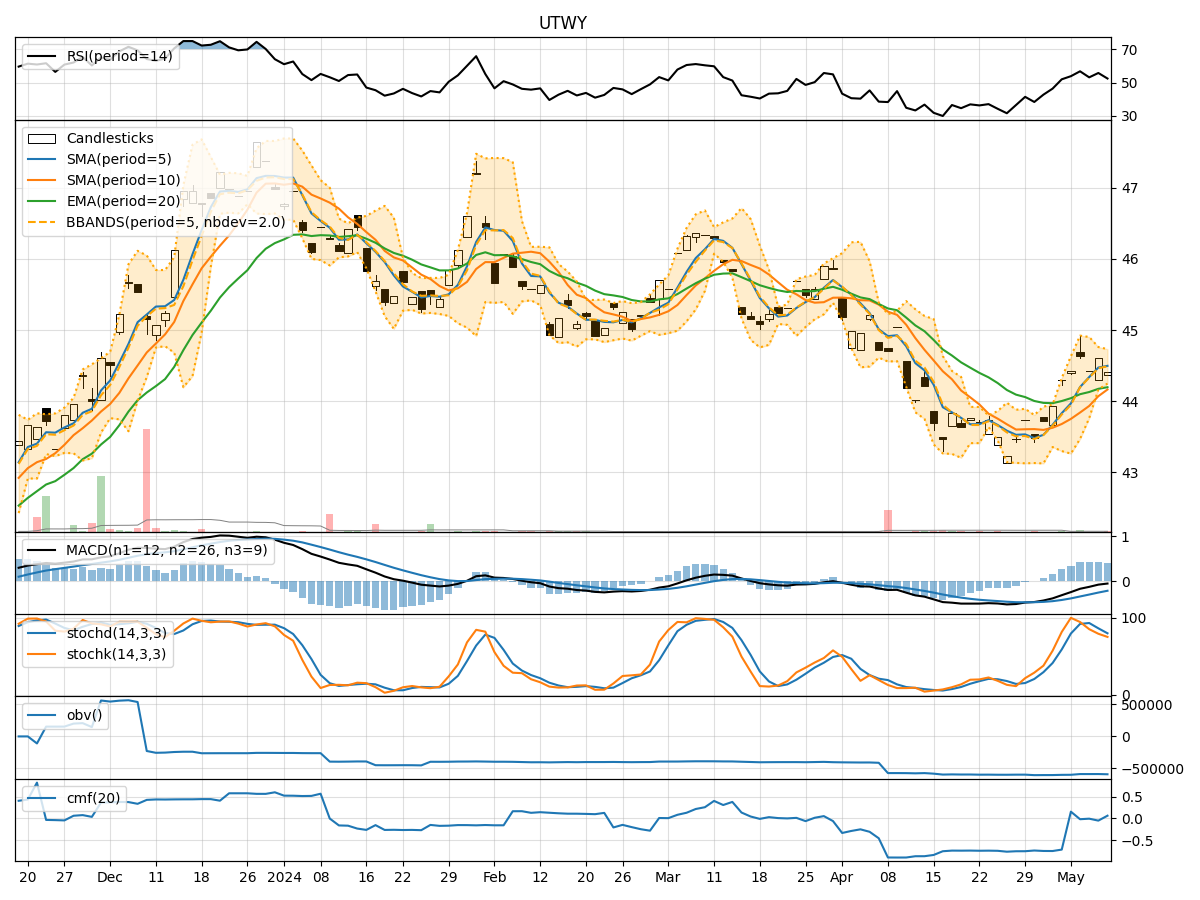
In analyzing the technical indicators for UTWY over the last 5 days, we will delve into the trend, momentum, volatility, and volume indicators to provide a comprehensive outlook on the possible stock price movement in the coming days. By examining these key indicators, we aim to offer valuable insights and predictions for potential investors.
Trend Analysis:
- Moving Averages (MA): The 5-day MA has been consistently above the closing prices, indicating a short-term uptrend.
- MACD: The MACD line has been below the signal line, suggesting a bearish momentum.
- EMA: The EMA has been slightly increasing, reflecting a gradual uptrend.
Key Observation: The trend indicators show a mixed signal with a slight bullish bias due to the MA and EMA, but the MACD indicates a bearish momentum.
Momentum Analysis:
- RSI: The RSI has been fluctuating around the neutral level, indicating indecision in the market.
- Stochastic Oscillator: Both %K and %D have been declining, signaling a potential bearish momentum.
- Williams %R: The indicator has been in the oversold territory, suggesting a possible reversal.
Key Observation: Momentum indicators are showing a bearish bias with the Stochastic Oscillator pointing towards a potential downtrend.
Volatility Analysis:
- Bollinger Bands (BB): The stock price has been trading within the bands, indicating normal volatility.
- Bollinger %B: The %B is hovering around the middle, suggesting balanced volatility.
Key Observation: Volatility indicators suggest a stable market environment with no extreme price movements expected.
Volume Analysis:
- On-Balance Volume (OBV): The OBV has been fluctuating, indicating mixed buying and selling pressure.
- Chaikin Money Flow (CMF): The CMF has been negative, suggesting a slight outflow of money from the stock.
Key Observation: Volume indicators show a lack of strong buying or selling pressure, leading to a neutral volume outlook.
Conclusion:
Based on the analysis of the technical indicators, the stock price of UTWY is likely to experience sideways consolidation in the coming days. The trend indicators show a slight bullish bias, while momentum indicators point towards a bearish momentum. Volatility remains stable, and volume indicators suggest a neutral stance. Therefore, it is recommended to exercise caution and closely monitor the price action for any potential breakout or reversal signals before making any trading decisions.