Technical Analysis of UVIX 2024-05-31
Overview:
In analyzing the technical indicators for UVIX over the last 5 days, we will delve into the trends, momentum, volatility, and volume indicators to provide a comprehensive outlook on the possible stock price movement in the coming days. By examining key metrics such as moving averages, MACD, RSI, Bollinger Bands, and OBV, we aim to offer valuable insights and predictions for UVIX.
Trend Indicators:
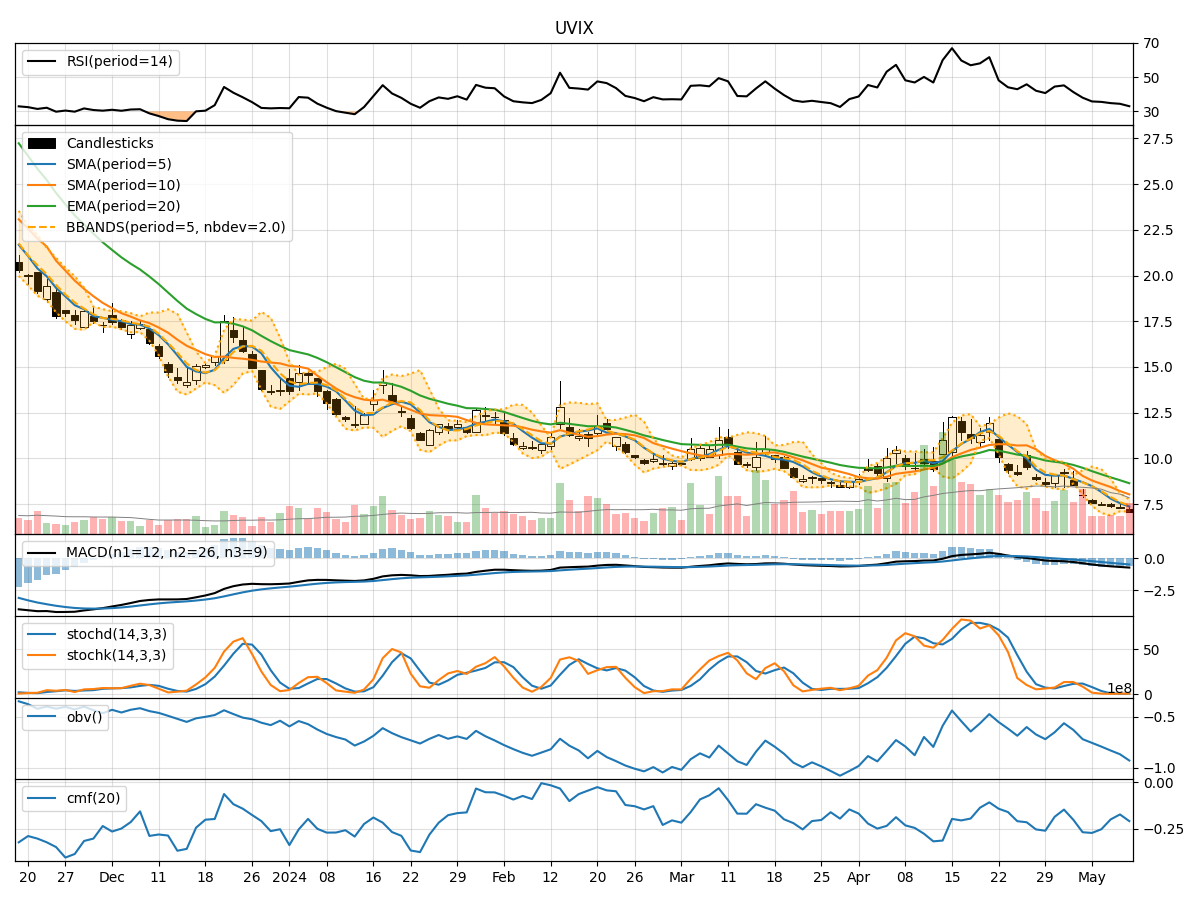
- Moving Averages (MA): The 5-day MA has been fluctuating around the actual closing prices, indicating short-term price trends. The SMA(10) and EMA(20) show a downward trend, suggesting a bearish sentiment in the mid to long term.
- MACD: The MACD line has been consistently negative, with the MACD histogram showing a slight uptrend. This indicates a potential reversal in the bearish momentum.
- Conclusion: The trend indicators suggest a bearish sentiment in the mid to long term, with a possible short-term reversal in momentum.
Momentum Indicators:
- RSI: The RSI has been gradually increasing but remains below the overbought threshold, indicating a neutral to slightly bullish momentum.
- Stochastic Oscillator: Both %K and %D have been rising, suggesting an increase in buying pressure.
- Conclusion: Momentum indicators point towards a neutral to slightly bullish sentiment in the short term.
Volatility Indicators:
- Bollinger Bands: The price has been trading within the bands, with the %B indicator hovering around the middle, indicating moderate volatility.
- Conclusion: Volatility indicators suggest a stable price movement with no extreme fluctuations expected in the near term.
Volume Indicators:
- On-Balance Volume (OBV): The OBV has been declining, indicating a decrease in buying volume over the past few days.
- Conclusion: Volume indicators signal a decrease in buying interest, which could potentially impact the price movement negatively.
Overall Conclusion:
Based on the analysis of trend, momentum, volatility, and volume indicators, the overall outlook for UVIX in the next few days leans towards a bearish sentiment in the mid to long term, with a neutral to slightly bullish bias in the short term. The stability in volatility suggests a lack of significant price swings, while the declining OBV raises concerns about weakening buying interest.
Recommendation:
Considering the technical indicators and the current market dynamics, it is advisable to exercise caution in trading UVIX. Investors may consider short-term bullish positions with tight stop-loss orders to manage risks effectively. However, for those with a longer-term perspective, it might be prudent to wait for more clarity in the price action before making substantial investment decisions.
Disclaimer:
Please note that technical analysis is not a guaranteed predictor of future price movements, and other fundamental factors can influence stock prices. It is essential to conduct thorough research and consider multiple indicators before making any investment decisions. Consulting with a financial advisor is recommended for personalized investment advice tailored to individual risk tolerance and financial goals.