Technical Analysis of UWM 2024-05-10
Overview:
In analyzing the technical indicators for UWM over the last 5 days, we will delve into the trend, momentum, volatility, and volume indicators to provide a comprehensive outlook on the possible stock price movement in the coming days. By examining these key aspects, we aim to offer valuable insights and predictions for potential investors.
Trend Analysis:
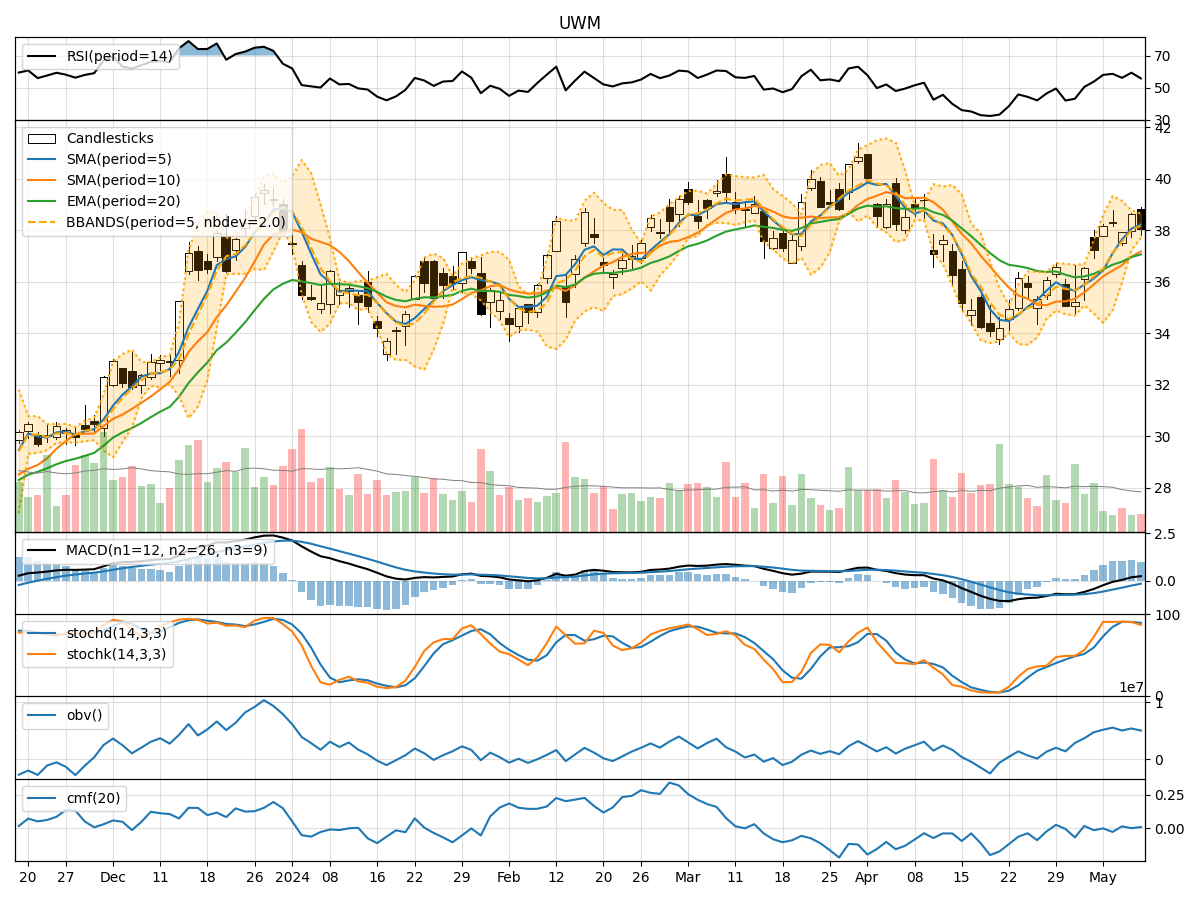
- Moving Averages (MA): The 5-day Moving Average (MA) has been consistently above the longer-term Simple Moving Average (SMA) and Exponential Moving Average (EMA), indicating a bullish trend.
- MACD: The Moving Average Convergence Divergence (MACD) has shown positive values, with the MACD line consistently above the Signal line, suggesting upward momentum.
Momentum Analysis:
- RSI: The Relative Strength Index (RSI) has been fluctuating around the 50 level, indicating a neutral momentum.
- Stochastic Oscillator: Both %K and %D have been relatively high, suggesting overbought conditions.
Volatility Analysis:
- Bollinger Bands (BB): The stock price has mostly stayed within the Bollinger Bands, with the bands narrowing, indicating decreasing volatility.
Volume Analysis:
- On-Balance Volume (OBV): The OBV has shown mixed movements, indicating indecision among investors.
- Chaikin Money Flow (CMF): The CMF has been hovering around the zero line, reflecting a balance between buying and selling pressure.
Key Observations:
- The trend indicators suggest a bullish sentiment, supported by the positive MACD values.
- Momentum indicators show a neutral stance, with the RSI around the midpoint and stochastic indicators in overbought territory.
- Volatility has been decreasing, as seen in the narrowing Bollinger Bands.
- Volume indicators reflect mixed signals, with OBV showing no clear trend and CMF indicating a balance between buying and selling pressure.
Conclusion:
Based on the analysis of the technical indicators, the next few days for UWM stock price movement are likely to be sideways with a slight bullish bias. The bullish trend indicated by moving averages and MACD may support some upward movement, but the neutral momentum and mixed volume signals suggest limited potential for significant gains. Additionally, the decreasing volatility implies a lack of strong market direction. Investors should exercise caution and closely monitor key levels for potential entry or exit points.
In summary, the overall outlook for UWM in the next few days leans towards consolidation with a mildly bullish inclination. It is essential for investors to remain vigilant and consider additional fundamental factors before making any trading decisions.