Technical Analysis of UXI 2024-05-10
Overview:
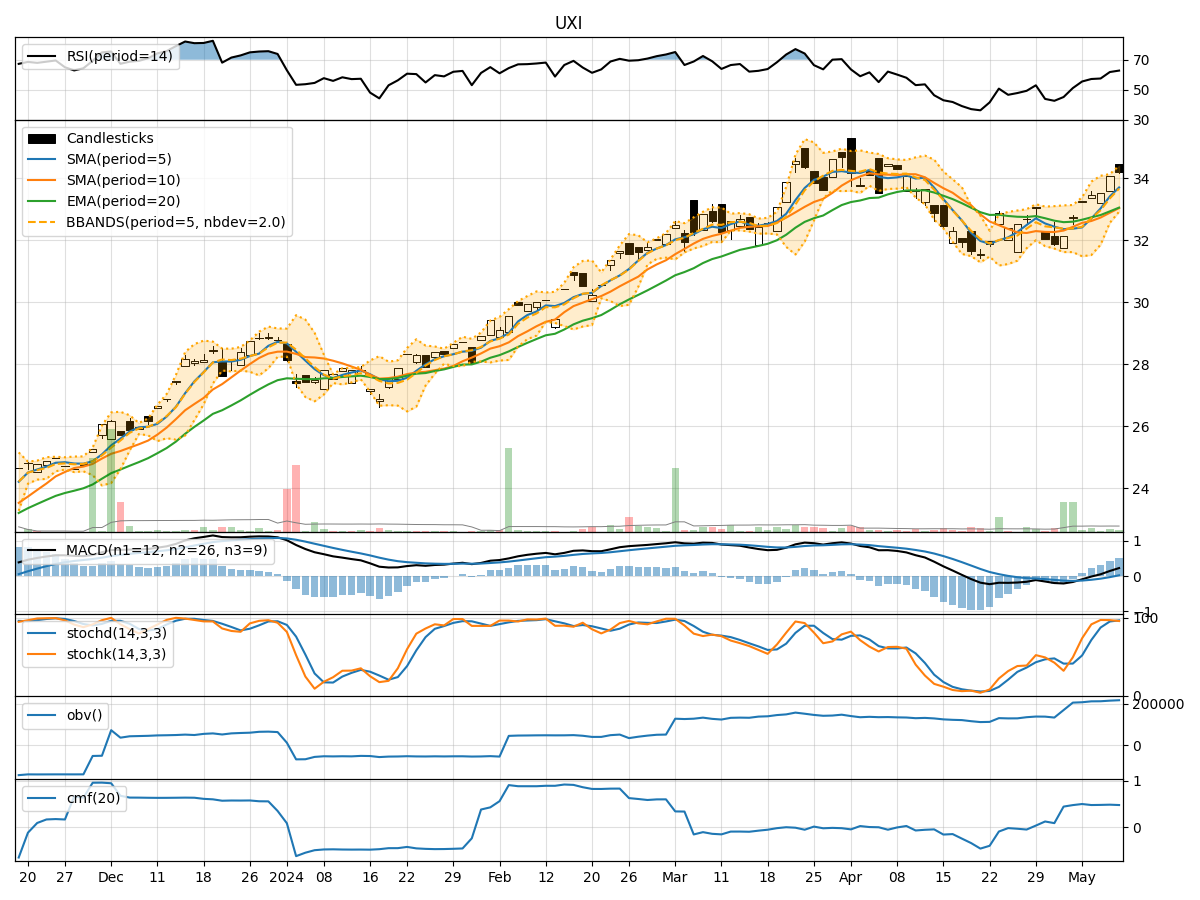
In analyzing the technical indicators for UXI over the last 5 days, we will delve into the trend, momentum, volatility, and volume indicators to provide a comprehensive outlook on the possible stock price movement in the coming days. By examining these key aspects, we aim to offer valuable insights and predictions for potential investors.
Trend Indicators:
- Moving Averages (MA): The 5-day moving average has been consistently above the longer-term SMAs and EMAs, indicating a bullish trend.
- MACD: The MACD line has been consistently above the signal line, suggesting upward momentum.
- MACD Histogram: The positive values of the MACD histogram indicate increasing bullish momentum.
Momentum Indicators:
- RSI: The RSI has been trending upwards, indicating increasing buying pressure.
- Stochastic Oscillator: Both %K and %D have been in overbought territory, suggesting a potential reversal or consolidation.
- Williams %R: The indicator has been fluctuating but generally in oversold territory, signaling a possible buying opportunity.
Volatility Indicators:
- Bollinger Bands: The price has been consistently trading above the middle Bollinger Band, indicating an uptrend.
- Bollinger %B: The %B value has been above 0.5, suggesting bullish momentum.
- Bollinger Band Width: The narrowing of the bands indicates decreasing volatility.
Volume Indicators:
- On-Balance Volume (OBV): The OBV has been steadily increasing, reflecting accumulation by investors.
- Chaikin Money Flow (CMF): The CMF has been positive, indicating buying pressure in the market.
Key Observations:
- Trend: The trend indicators suggest a strong bullish sentiment in the stock.
- Momentum: While momentum indicators show overbought conditions, the RSI indicates room for further upside.
- Volatility: The narrowing Bollinger Bands and decreasing volatility suggest a potential period of consolidation.
- Volume: Increasing OBV and positive CMF point towards continued buying interest.
Conclusion:
Based on the analysis of the technical indicators, the stock is likely to experience further upward movement in the coming days. The bullish trend, supported by positive momentum and volume indicators, indicates a favorable outlook for UXI. Traders may consider buying opportunities on pullbacks or consolidations, as the overall market sentiment remains positive. It is essential to monitor the stochastic oscillator for potential reversals and adjust risk management strategies accordingly.