Technical Analysis of UYLD 2024-05-10
Overview:
In analyzing the technical indicators for UYLD over the last 5 days, we will delve into the trend, momentum, volatility, and volume indicators to provide a comprehensive outlook on the possible stock price movement in the coming days. By examining these key aspects, we aim to offer valuable insights and recommendations for potential investors.
Trend Analysis:
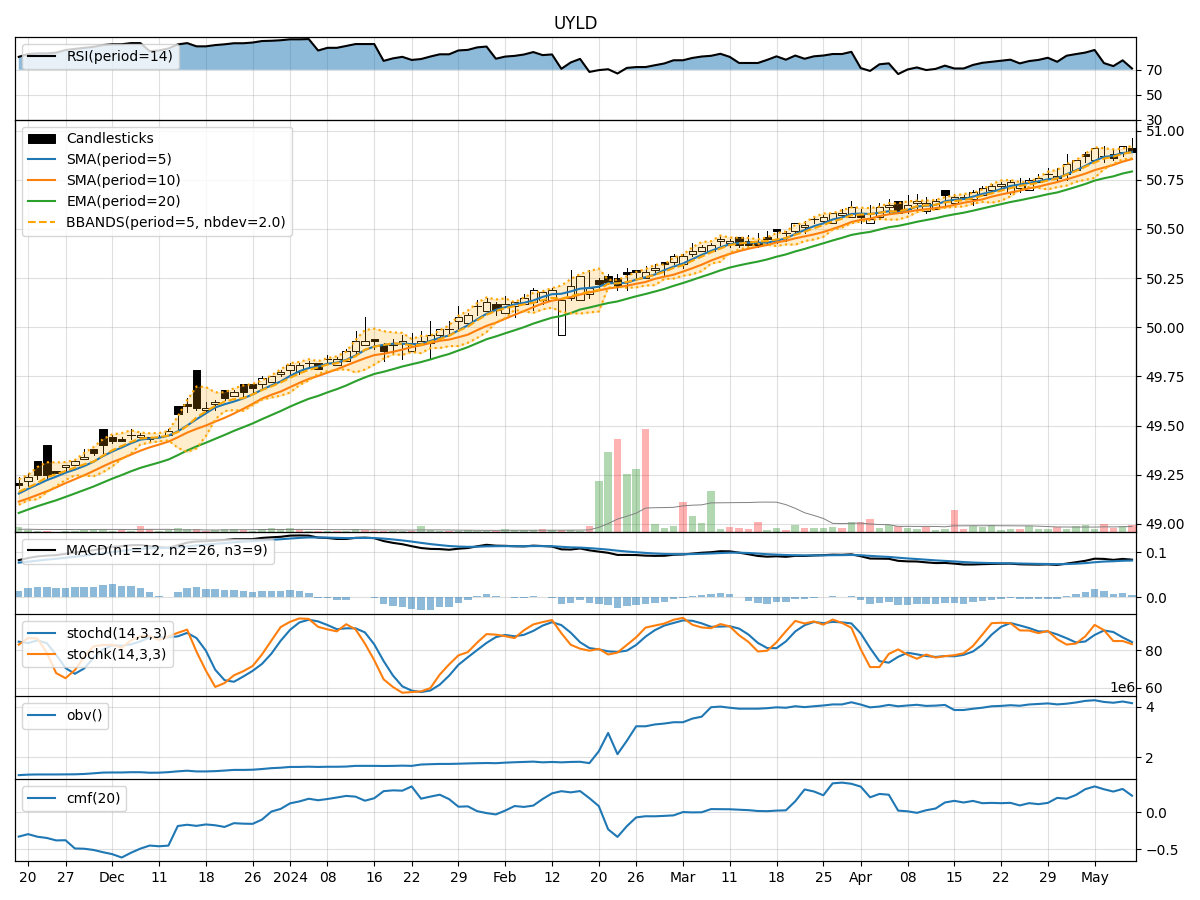
- Moving Averages (MA): The 5-day Moving Average (MA) has been consistently above the Simple Moving Average (SMA) and Exponential Moving Average (EMA), indicating a bullish trend.
- MACD: The MACD line has been positive, with the MACD Histogram also showing positive values, suggesting upward momentum in the stock price.
Momentum Analysis:
- RSI: The Relative Strength Index (RSI) has been relatively high, indicating overbought conditions in the stock.
- Stochastic Oscillator: Both %K and %D have been above 80, signaling potential overbought conditions.
- Williams %R: The Williams %R has been fluctuating around -20 and -25, indicating potential overbought conditions.
Volatility Analysis:
- Bollinger Bands (BB): The stock price has been trading within the Bollinger Bands, with the %B indicator around 0.5, suggesting a neutral stance in terms of volatility.
Volume Analysis:
- On-Balance Volume (OBV): The OBV has shown a slight decrease over the last few days, indicating some selling pressure.
- Chaikin Money Flow (CMF): The CMF has been positive but trending downwards, suggesting a potential decrease in buying pressure.
Key Observations and Opinions:
- Trend: The stock is currently in an upward trend based on moving averages and MACD analysis.
- Momentum: Momentum indicators suggest that the stock may be overbought at the moment.
- Volatility: Volatility remains relatively stable with the stock trading within the Bollinger Bands.
- Volume: The decrease in OBV and CMF trending downwards indicate a potential decrease in buying pressure.
Conclusion:
Based on the analysis of the technical indicators, the next few days' possible stock price movement for UYLD could see a short-term correction or consolidation. The stock is currently exhibiting signs of being overbought, coupled with a decrease in buying pressure as indicated by volume indicators. Investors should exercise caution and consider waiting for a better entry point before considering a long position.