Technical Analysis of VB 2024-05-10
Overview:
In analyzing the technical indicators for VB stock over the last 5 days, we will delve into the trend, momentum, volatility, and volume indicators to provide a comprehensive outlook on the possible stock price movement in the coming days.
Trend Analysis:
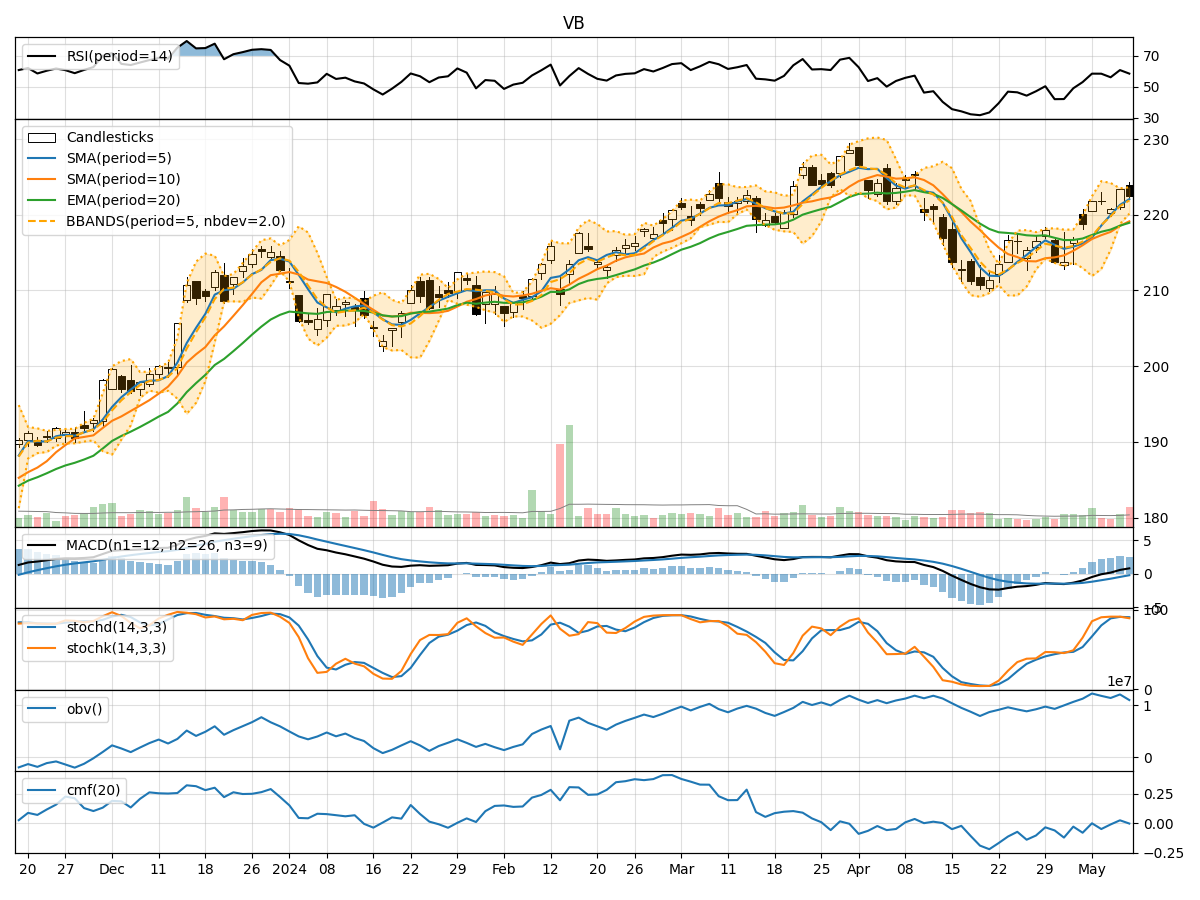
- Moving Averages (MA): The 5-day Moving Average (MA) has been consistently above the Simple Moving Average (SMA) and Exponential Moving Average (EMA), indicating a bullish trend.
- MACD: The MACD line has been consistently above the signal line, with both lines showing an upward trend, suggesting bullish momentum.
- RSI: The Relative Strength Index (RSI) has been fluctuating around the 60-70 range, indicating a neutral to slightly bullish sentiment.
Momentum Analysis:
- Stochastic Oscillator: The Stochastic Oscillator has been in the overbought zone, suggesting a potential reversal or consolidation.
- Williams %R: The Williams %R has been hovering around oversold levels, indicating a possible bullish reversal.
Volatility Analysis:
- Bollinger Bands: The Bollinger Bands have been narrowing, indicating decreasing volatility and a potential breakout or breakdown in the near future.
Volume Analysis:
- On-Balance Volume (OBV): The OBV has been fluctuating, indicating mixed buying and selling pressure.
- Chaikin Money Flow (CMF): The CMF has been slightly negative, suggesting some distribution in the stock.
Key Observations:
- The trend indicators suggest a strong bullish sentiment in the short term.
- Momentum indicators show signs of potential reversal or consolidation.
- Volatility is decreasing, indicating a possible price breakout.
- Volume indicators reflect mixed buying and selling pressure.
Conclusion:
Based on the analysis of the technical indicators, the next few days' possible stock price movement for VB stock is likely to be upward in the short term. However, there may be a period of consolidation or a minor pullback due to overbought conditions indicated by the Stochastic Oscillator. Traders should closely monitor the price action for a potential breakout above the upper Bollinger Band to confirm the bullish momentum. Overall, the outlook remains bullish with a potential for a short-term correction before resuming the upward trend.