Technical Analysis of VBK 2024-05-10
Overview:
In analyzing the technical indicators for VBK over the last 5 days, we will delve into the trend, momentum, volatility, and volume indicators to provide a comprehensive outlook on the possible stock price movement in the coming days. By examining these key aspects, we aim to offer valuable insights and recommendations for potential investors.
Trend Indicators:
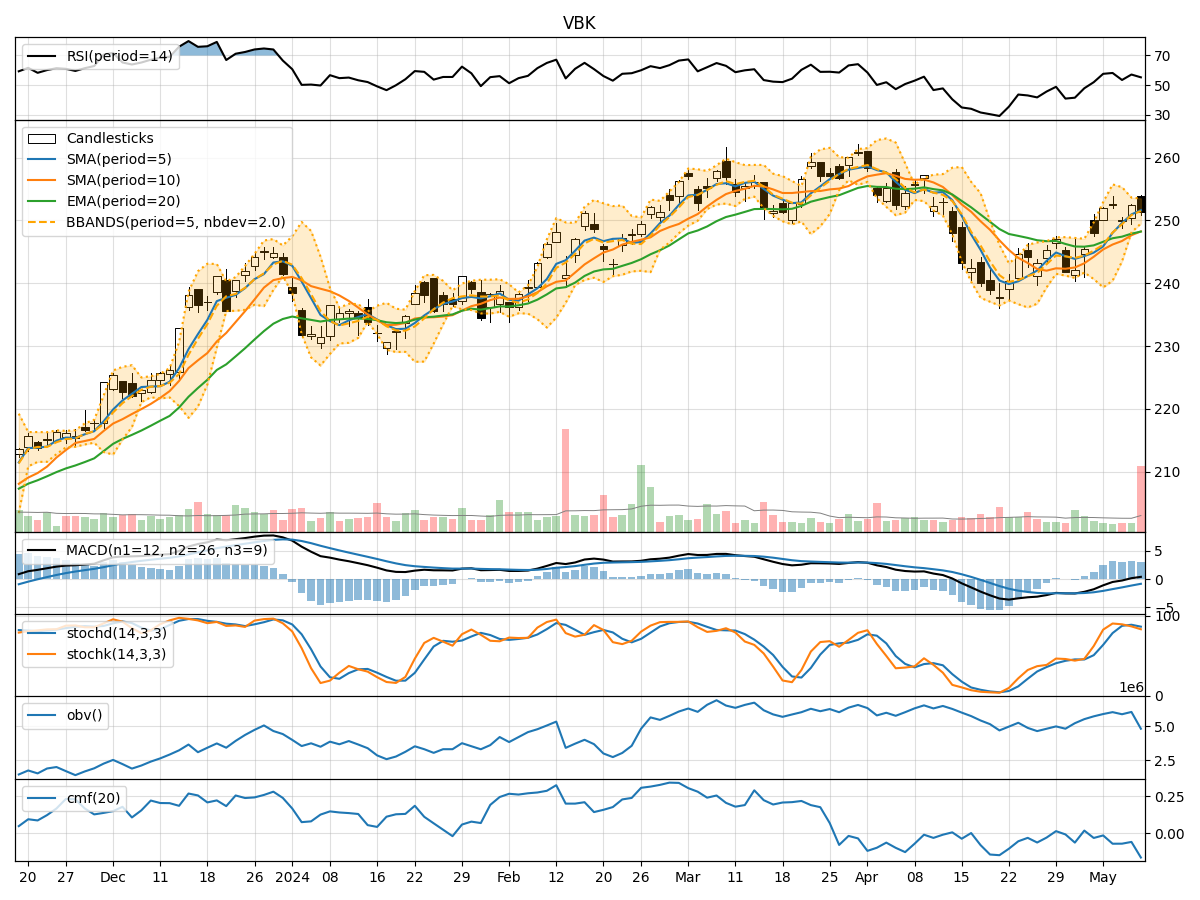
- Moving Averages (MA): The 5-day MA has been consistently above the 10-day SMA, indicating a short-term bullish trend. The EMA(20) has shown a slight upward trajectory, suggesting a positive momentum in the mid to long term.
- MACD: The MACD line has been above the signal line for the past few days, indicating a bullish trend. The MACD histogram has been mostly positive, further supporting the bullish sentiment.
Momentum Indicators:
- RSI: The RSI has been fluctuating around the 50 level, indicating a neutral momentum in the stock. There is no extreme overbought or oversold conditions based on RSI.
- Stochastic Oscillator: Both %K and %D lines of the Stochastic Oscillator have been hovering in the overbought territory, suggesting a potential reversal or consolidation phase.
- Williams %R (WillR): The Williams %R has been oscillating in the oversold region, indicating a bearish sentiment in the short term.
Volatility Indicators:
- Bollinger Bands (BB): The stock price has mostly stayed within the Bollinger Bands, with the bands narrowing in recent days. This could signal a period of consolidation or reduced volatility.
- Bollinger %B (BBP): The %B indicator has been decreasing, indicating a potential decrease in volatility and a possible consolidation phase.
Volume Indicators:
- On-Balance Volume (OBV): The OBV has shown mixed signals, with fluctuations in volume without a clear trend. This suggests indecision among market participants.
- Chaikin Money Flow (CMF): The CMF has been negative, indicating that money may be flowing out of the stock. This could signal a bearish sentiment among investors.
Conclusion:
Based on the analysis of the technical indicators, the stock price of VBK is likely to experience sideways movement or consolidation in the coming days. The trend indicators suggest a bullish bias in the short to mid-term, while momentum indicators point towards a potential reversal or consolidation phase. Volatility indicators indicate a decrease in volatility, supporting the view of a sideways movement. The volume indicators reflect indecision among investors, further reinforcing the expectation of a period of consolidation.
In conclusion, it is recommended to closely monitor the price action and key support/resistance levels for potential trading opportunities. Exercise caution in making significant trading decisions until a clearer trend emerges in the market.