Technical Analysis of VBR 2024-05-10
Overview:
In analyzing the technical indicators for VBR over the last 5 days, we will delve into the trend, momentum, volatility, and volume indicators to provide a comprehensive outlook on the possible stock price movement in the coming days. By examining these key aspects, we aim to offer valuable insights and predictions for informed decision-making.
Trend Indicators:
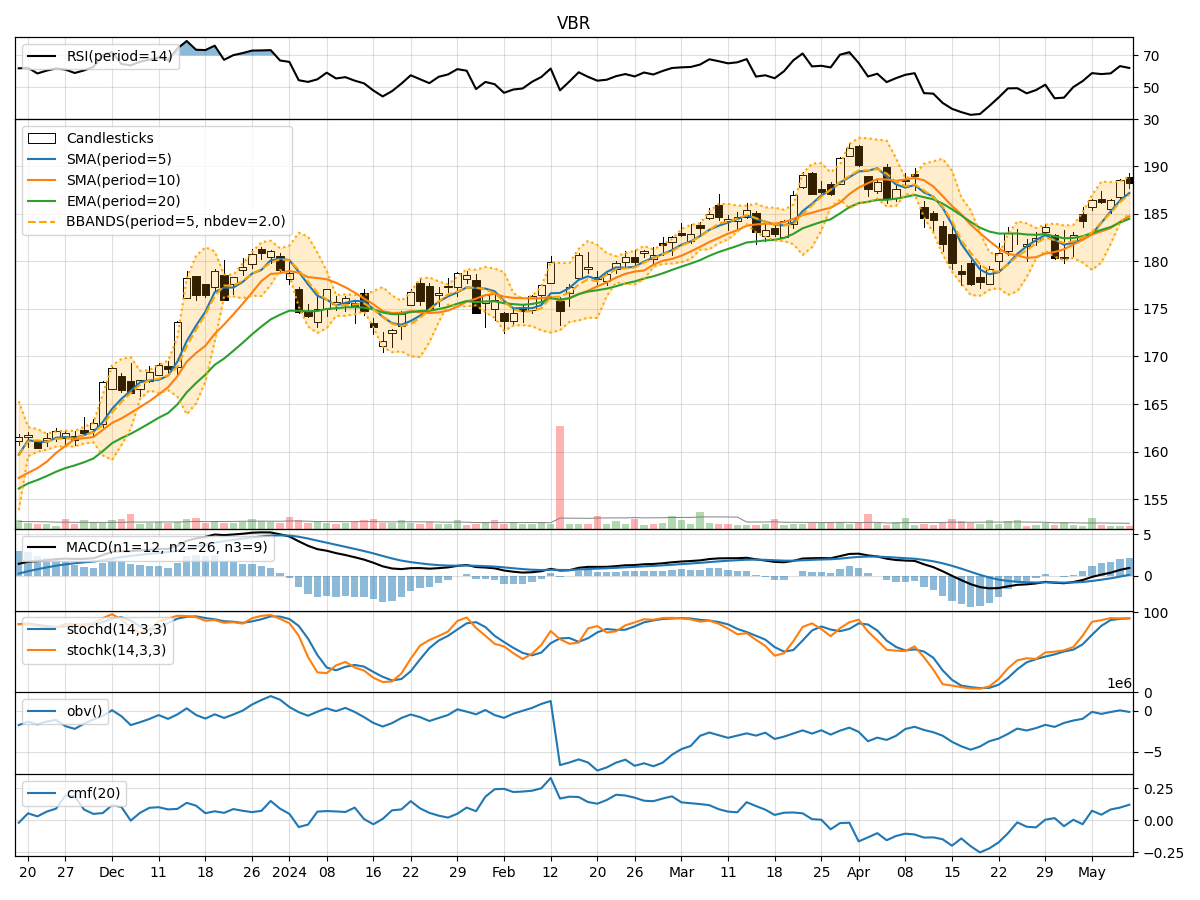
- Moving Averages (MA): The 5-day MA has been consistently rising, indicating a bullish trend in the short term.
- MACD: The MACD line has been above the signal line, suggesting a bullish momentum.
- MACD Histogram: The histogram has been increasing, indicating strengthening bullish momentum.
Momentum Indicators:
- RSI: The RSI has been in the neutral zone, suggesting neither overbought nor oversold conditions.
- Stochastic Oscillator: Both %K and %D have been in the overbought territory, indicating a potential reversal.
- Williams %R: The indicator has been in the oversold region, signaling a possible buying opportunity.
Volatility Indicators:
- Bollinger Bands: The stock price has been trading within the bands, indicating normal volatility.
- Bollinger %B: The %B indicator has been fluctuating around the midline, suggesting a balanced market sentiment.
Volume Indicators:
- On-Balance Volume (OBV): The OBV has shown mixed signals, reflecting indecision among market participants.
- Chaikin Money Flow (CMF): The CMF has been slightly positive, indicating some buying pressure.
Key Observations:
- The trend indicators point towards a bullish sentiment in the short term.
- Momentum indicators suggest a mixed outlook with potential for a reversal.
- Volatility indicators indicate normal price fluctuations.
- Volume indicators reflect indecisiveness among investors.
Conclusion:
Based on the analysis of the technical indicators, the next few days for VBR could see upward price movement in the short term, supported by the bullish trend and momentum indicators. However, caution is advised due to the mixed signals from the momentum indicators, which could lead to a potential reversal. Overall, the stock is likely to experience increased volatility but with a bullish bias in the near future. Investors should closely monitor key levels and market developments to make informed decisions.