Technical Analysis of VCAR 2024-05-10
Overview:
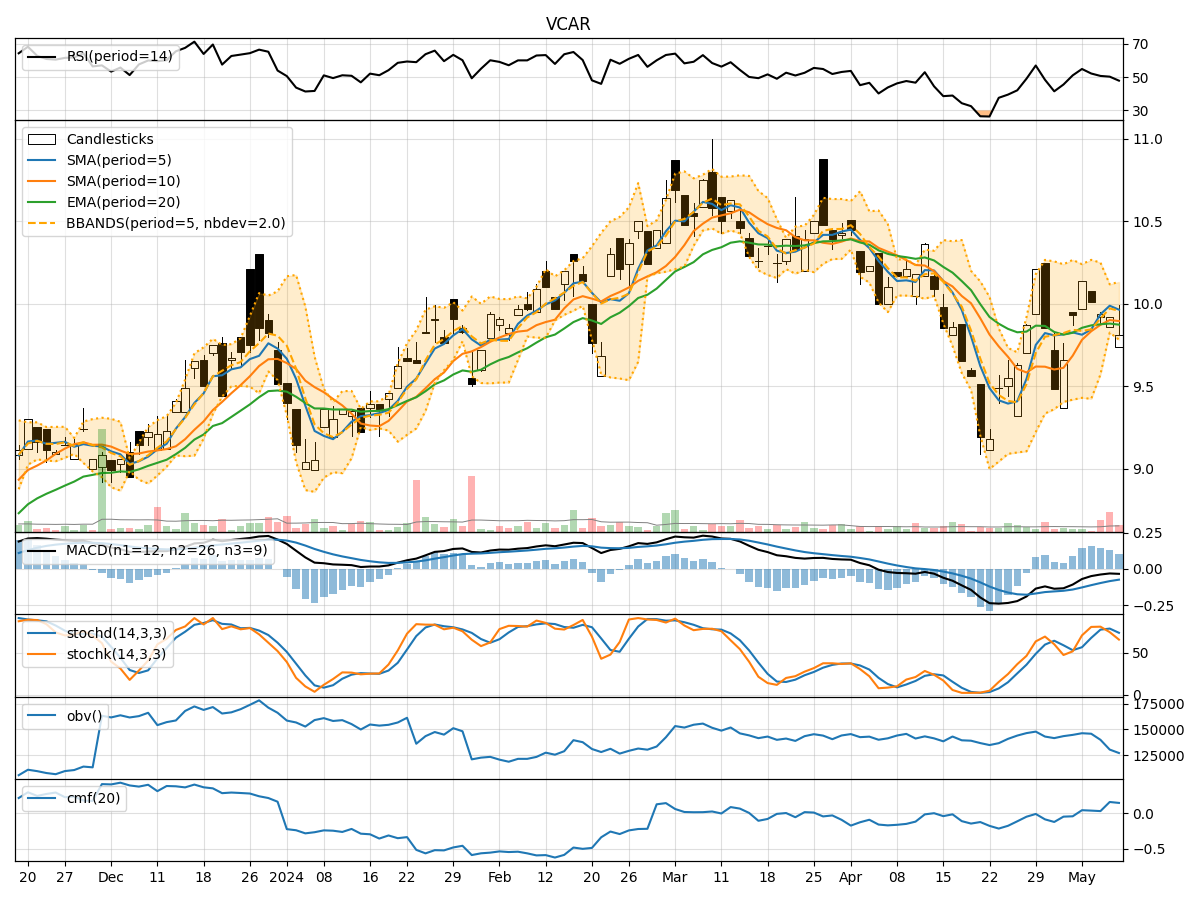
In analyzing the technical indicators for VCAR over the last 5 days, we will delve into the trend, momentum, volatility, and volume indicators to provide a comprehensive outlook on the possible stock price movement in the coming days. By examining these key aspects, we aim to offer valuable insights and predictions to guide your investment decisions.
Trend Indicators:
- Moving Averages (MA): The 5-day MA has been fluctuating around the 10-day Simple Moving Average (SMA), indicating short-term price volatility.
- MACD: The Moving Average Convergence Divergence (MACD) has been negative, suggesting a bearish trend in the stock price.
- EMA: The Exponential Moving Average (EMA) has been slightly declining, reflecting a weakening trend.
Key Observation: The trend indicators point towards a bearish sentiment in the stock price.
Momentum Indicators:
- RSI: The Relative Strength Index (RSI) has been decreasing, indicating a loss in buying momentum.
- Stochastic Oscillator: Both %K and %D have been declining, signaling a potential reversal in price direction.
- Williams %R: The indicator has been in the oversold territory, suggesting a possible upcoming price bounce.
Key Observation: Momentum indicators are currently bearish but showing signs of potential reversal.
Volatility Indicators:
- Bollinger Bands: The bands have been narrowing, indicating decreasing volatility and a possible period of consolidation.
- Bollinger %B: The %B indicator has been hovering around 0.5, suggesting a balanced market sentiment.
Key Observation: Volatility indicators suggest a sideways movement or consolidation phase.
Volume Indicators:
- On-Balance Volume (OBV): The OBV has been declining, indicating selling pressure in the stock.
- Chaikin Money Flow (CMF): The CMF has been positive but decreasing, signaling a potential outflow of money from the stock.
Key Observation: Volume indicators reflect a bearish sentiment with decreasing buying interest.
Conclusion:
Based on the analysis of the technical indicators, the next few days' possible stock price movement for VCAR is likely to be downward. The trend indicators, momentum indicators, and volume indicators all point towards a bearish sentiment in the stock price. While volatility indicators suggest a period of consolidation, the overall outlook remains negative. Traders and investors should exercise caution and consider potential short-selling opportunities or wait for a clearer signal of a trend reversal before considering long positions.
Key Recommendations:
- Monitor the price closely for any signs of a trend reversal.
- Consider implementing risk management strategies to protect against potential losses.
- Stay informed about any significant news or events that could impact the stock price.
By staying vigilant and utilizing a combination of technical analysis and market insights, investors can make informed decisions to navigate the dynamic stock market landscape effectively.