Technical Analysis of VCEB 2024-05-10
Overview:
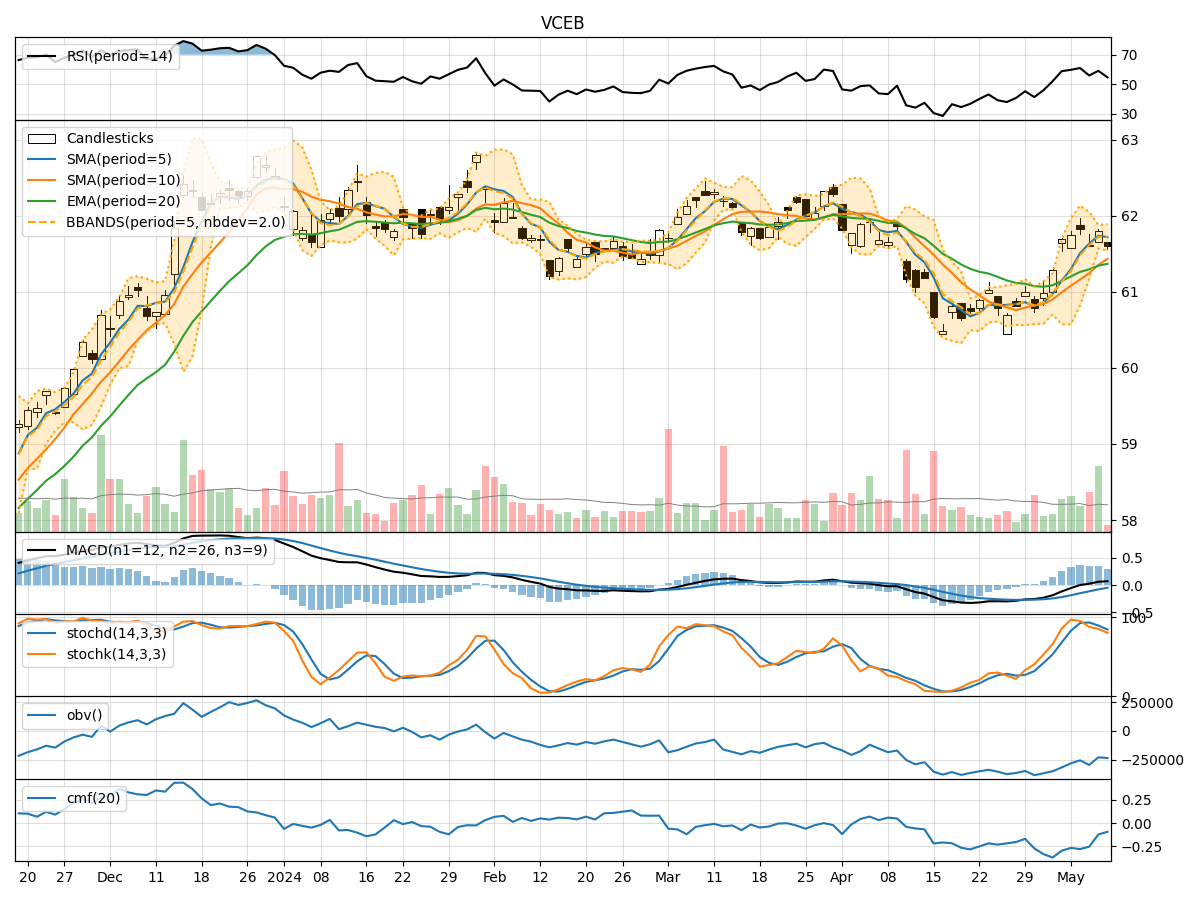
In analyzing the technical indicators for VCEB over the last 5 days, we will delve into the trend, momentum, volatility, and volume indicators to provide a comprehensive assessment of the stock's potential price movement. By examining these key aspects, we aim to offer valuable insights and predictions for the next few days.
Trend Analysis:
- Moving Averages (MA): The 5-day MA has been consistently above the closing prices, indicating a short-term uptrend.
- MACD: The MACD line has been positive and increasing, suggesting bullish momentum.
- RSI: The RSI values have been fluctuating but generally staying within the neutral to overbought territory.
Key Observation: The trend indicators point towards a bullish sentiment in the short term.
Momentum Analysis:
- Stochastic Oscillator: Both %K and %D have been gradually decreasing, indicating a potential reversal in momentum.
- Williams %R: The indicator has been in the oversold region, suggesting a possible upcoming price correction.
Key Observation: Momentum indicators signal a potential reversal or consolidation in the near future.
Volatility Analysis:
- Bollinger Bands (BB): The bands have been narrowing, indicating decreasing volatility.
- BB %B: The %B value has been hovering around the midline, reflecting a balanced market sentiment.
Key Observation: Volatility indicators suggest a calm or stable market environment.
Volume Analysis:
- On-Balance Volume (OBV): The OBV has shown mixed movements, indicating indecision among market participants.
- Chaikin Money Flow (CMF): The CMF has been negative, suggesting outflow of money from the stock.
Key Observation: Volume indicators imply uncertainty in market sentiment.
Conclusion:
Based on the analysis of trend, momentum, volatility, and volume indicators, the next few days' possible stock price movement for VCEB is likely to experience a consolidation phase with a potential for a slight downward correction. Traders should exercise caution and closely monitor key support and resistance levels for potential entry or exit points.
Expert Opinion:
Given the current technical outlook, it is advisable to adopt a cautious stance towards VCEB in the short term. Traders may consider waiting for clearer signals or confirmation of a new trend direction before making significant trading decisions. Remember to always implement proper risk management strategies to protect your capital in uncertain market conditions.