Technical Analysis of VCRB 2024-05-10
Overview:
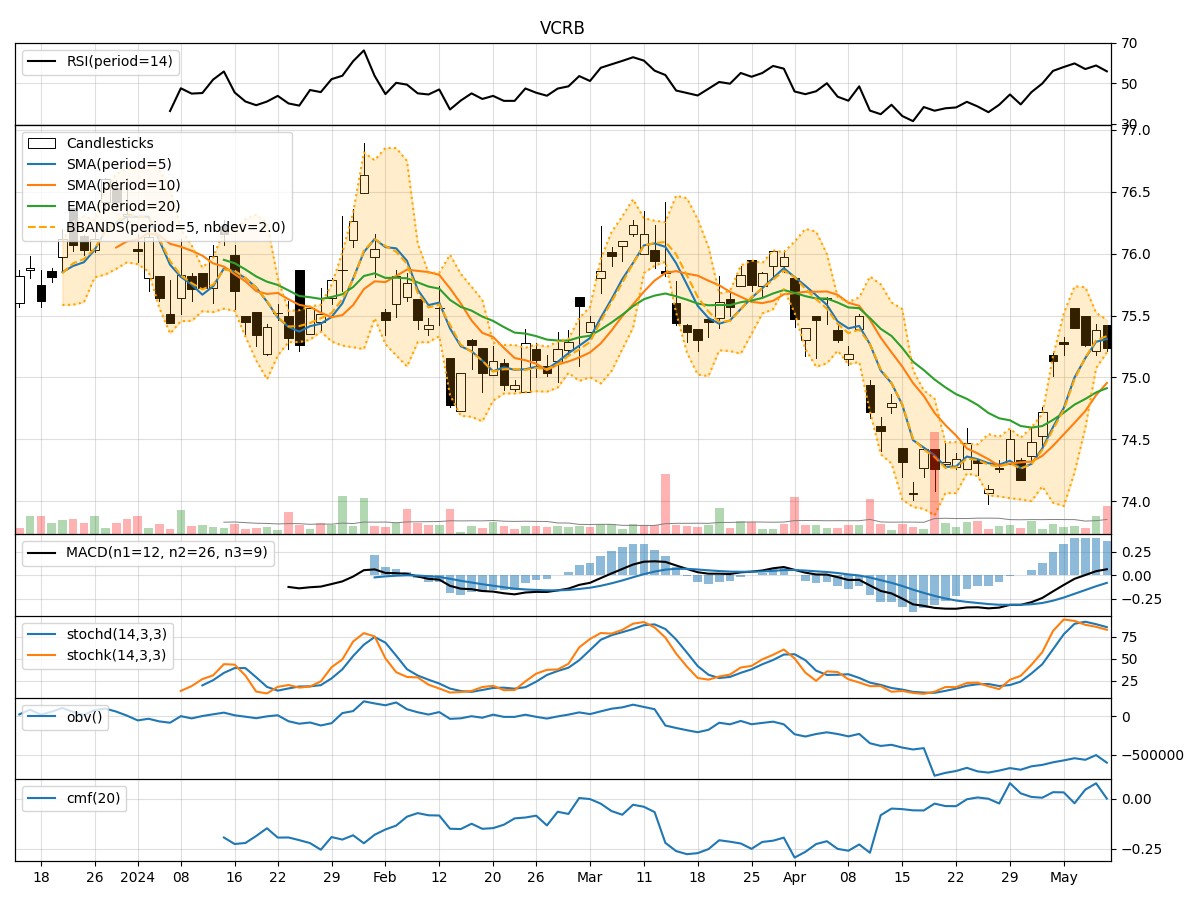
In analyzing the technical indicators for VCRB over the last 5 days, we will delve into the trend, momentum, volatility, and volume indicators to provide a comprehensive outlook on the possible stock price movement in the coming days. By examining these key aspects, we aim to offer valuable insights and predictions for informed decision-making.
Trend Indicators Analysis:
- Moving Averages (MA): The 5-day MA has been consistently above the closing prices, indicating a short-term uptrend.
- MACD: The MACD line has been positive, suggesting bullish momentum.
- MACD Histogram: The histogram has been above the zero line, indicating increasing bullish momentum.
Key Observation: The trend indicators point towards a bullish sentiment in the short term.
Momentum Indicators Analysis:
- RSI: The RSI has been fluctuating around the 50 level, indicating a neutral momentum.
- Stochastic Oscillator: Both %K and %D have been declining, signaling a potential reversal in momentum.
- Williams %R: The indicator has been in oversold territory, suggesting a possible reversal.
Key Observation: Momentum indicators suggest a neutral to bearish momentum outlook.
Volatility Indicators Analysis:
- Bollinger Bands: The price has been trading within the bands, indicating normal volatility.
- Bollinger %B: The %B has been fluctuating around the midline, suggesting balanced volatility.
Key Observation: Volatility indicators imply a stable price movement environment.
Volume Indicators Analysis:
- On-Balance Volume (OBV): The OBV has been fluctuating, indicating indecision among market participants.
- Chaikin Money Flow (CMF): The CMF has been positive, suggesting buying pressure.
Key Observation: Volume indicators reflect mixed sentiment among investors.
Conclusion:
Based on the analysis of trend, momentum, volatility, and volume indicators, the overall outlook for VCRB in the next few days appears to be a mixed sentiment. While trend indicators signal a bullish trend, momentum indicators suggest a neutral to bearish momentum. Volatility indicators point towards stability, and volume indicators indicate mixed sentiment among investors.
Recommendation:
Considering the mixed signals from the technical indicators, it is advisable to exercise caution and closely monitor the price action in the coming days. Traders may consider implementing risk management strategies to navigate the potential volatility and uncertainty in the market. Additionally, staying informed about any significant news or events that could impact the stock price is crucial for making well-informed trading decisions.
Disclaimer:
The analysis provided is based on historical data and technical indicators, and it is essential to conduct further research and analysis before making any investment decisions. Market conditions can change rapidly, and other external factors may influence stock price movements. It is recommended to consult with a financial advisor or conduct thorough due diligence before making any trading or investment decisions.