Technical Analysis of VCSH 2024-05-10
Overview:
In analyzing the technical indicators for VCSH over the last 5 days, we will delve into the trend, momentum, volatility, and volume indicators to provide a comprehensive outlook on the possible stock price movement in the coming days. By examining these key indicators, we aim to offer valuable insights and predictions for potential investors.
Trend Analysis:
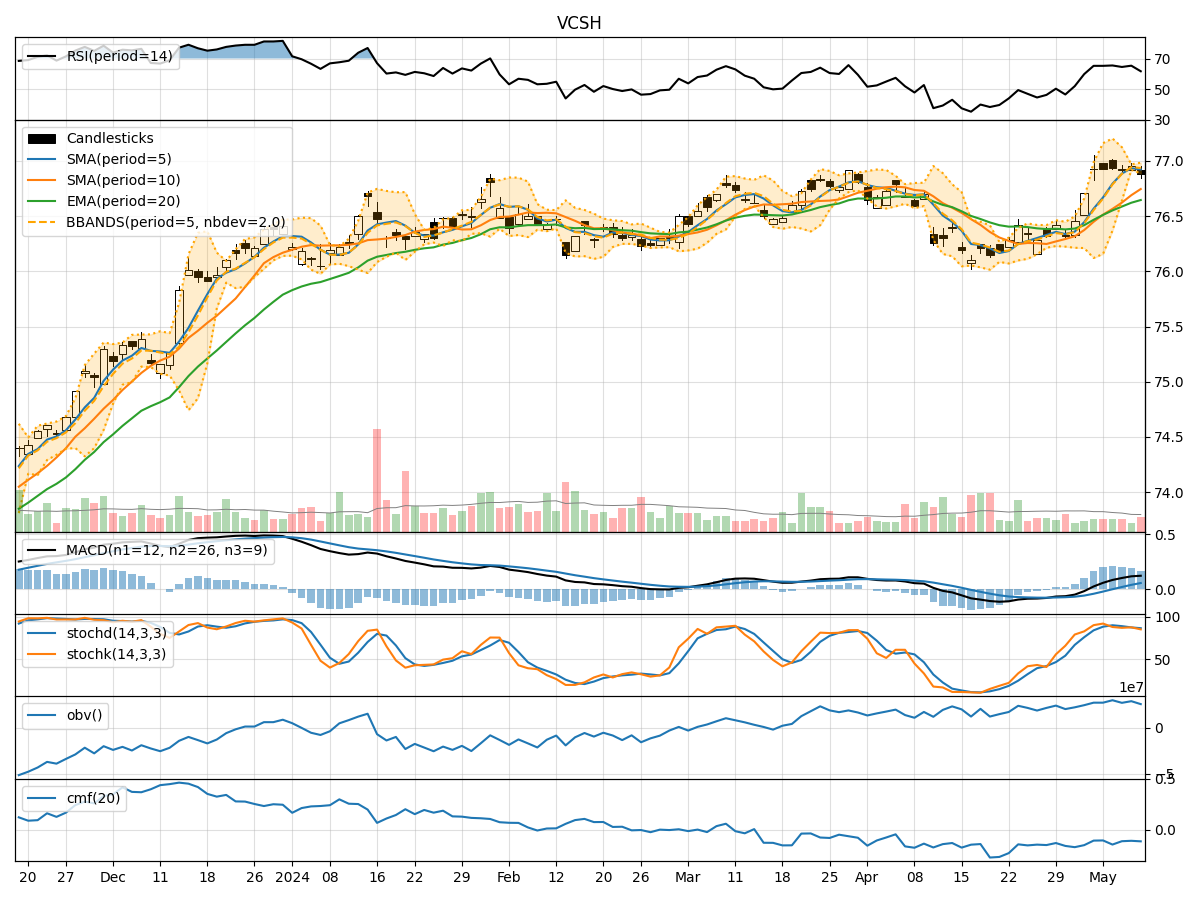
- Moving Averages (MA): The 5-day Moving Average (MA) has been consistently above the Simple Moving Average (SMA) and Exponential Moving Average (EMA), indicating a bullish trend.
- MACD: The MACD line has been consistently above the signal line, with the MACD histogram showing an increasing positive trend, suggesting bullish momentum.
Momentum Analysis:
- RSI: The Relative Strength Index (RSI) has been fluctuating around the 60-70 range, indicating a neutral to slightly bullish momentum.
- Stochastic Oscillator: Both %K and %D have been gradually decreasing but remain in the overbought territory, suggesting a potential reversal in the near future.
Volatility Analysis:
- Bollinger Bands (BB): The stock price has been trading within the Bollinger Bands, with the bands narrowing, indicating decreasing volatility.
- Bollinger %B: The %B indicator has been hovering around the midpoint, suggesting a balanced market sentiment.
Volume Analysis:
- On-Balance Volume (OBV): The OBV has been fluctuating, indicating indecision among investors regarding the stock.
- Chaikin Money Flow (CMF): The CMF has been negative, reflecting selling pressure in the market.
Key Observations:
- The trend indicators suggest a bullish sentiment, supported by the MACD analysis.
- Momentum indicators show a neutral to slightly bullish momentum, with the Stochastic Oscillator hinting at a potential reversal.
- Volatility indicators point towards decreasing volatility and a balanced market sentiment.
- Volume indicators reflect indecision among investors, with selling pressure indicated by the CMF.
Conclusion:
Based on the analysis of the technical indicators, the stock price of VCSH is likely to experience sideways movement in the next few days. The bullish trend indicated by the moving averages and MACD may be offset by the neutral to slightly bullish momentum and the potential reversal suggested by the Stochastic Oscillator. The decreasing volatility and mixed volume signals further support the expectation of sideways movement. Investors should closely monitor the Stochastic Oscillator for a potential trend reversal and consider the overall market sentiment before making trading decisions.