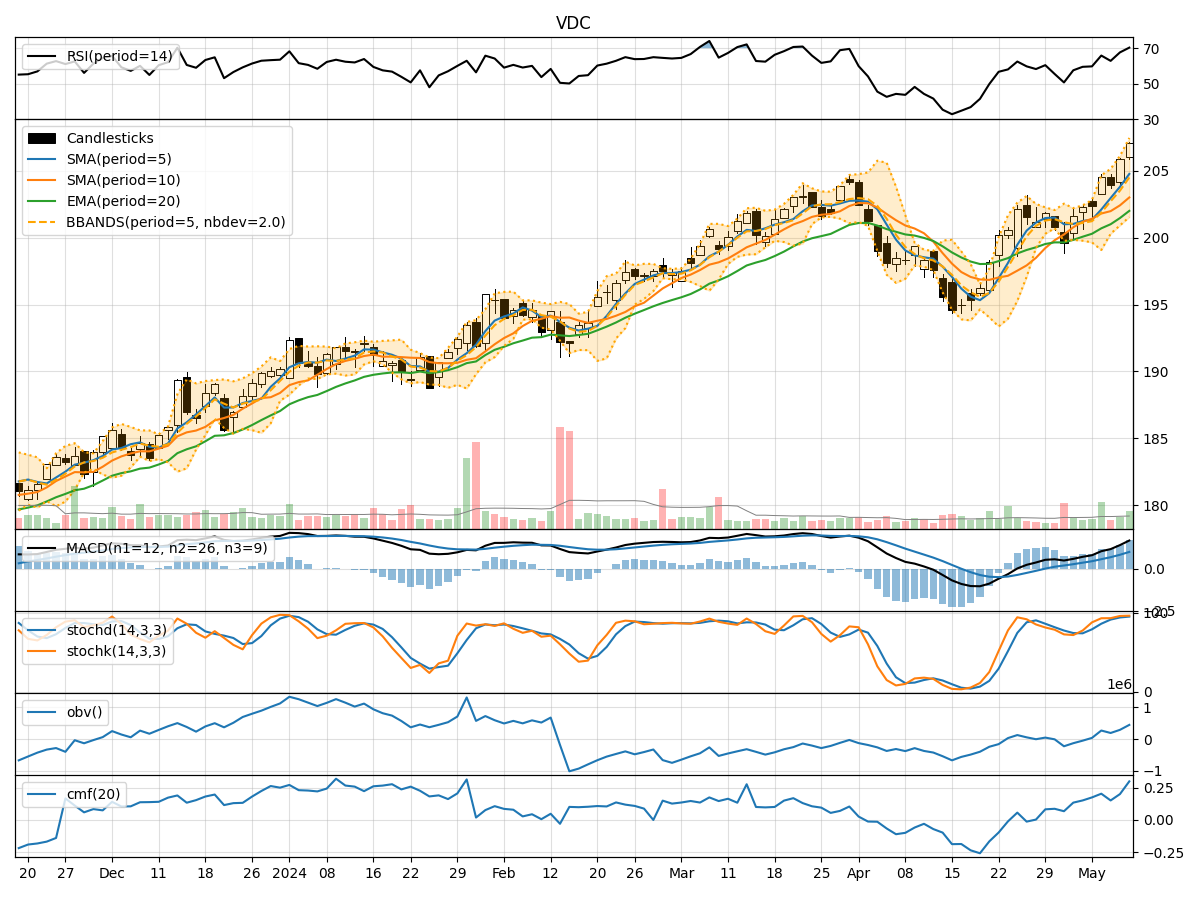
Technical Analysis of VDC 2024-05-10
Overview:
In the last 5 trading days, VDC stock has shown a consistent uptrend in its price movement. The moving averages (MA) have been trending upwards, with the 5-day MA consistently above the 10-day simple moving average (SMA) and the 20-day exponential moving average (EMA). The MACD line has been increasing, indicating a strengthening bullish momentum. The Relative Strength Index (RSI) and Stochastic indicators are in the overbought region, suggesting a potential pullback. The Bollinger Bands are widening, indicating increased volatility. On-balance volume (OBV) has been mixed, showing some distribution pressure.
Trend Indicators:
- The moving averages (MA) are trending upwards, indicating a bullish trend.
- The MACD line and signal line are both positive and increasing, suggesting strong bullish momentum.
- The RSI is in the overbought region, indicating a potential reversal or consolidation.
Momentum Indicators:
- The RSI and Stochastic indicators are in the overbought region, signaling a potential pullback or consolidation.
- The Williams %R indicator is also in the oversold region, supporting the potential for a reversal.
Volatility Indicators:
- The Bollinger Bands are widening, indicating increased volatility in the stock price.
- The Bollinger Bands %B indicator is above 0.8, suggesting the stock is trading near the upper band.
Volume Indicators:
- The OBV has shown mixed signals, indicating some distribution pressure.
- The Chaikin Money Flow (CMF) indicator is positive but has been decreasing slightly, suggesting a potential decrease in buying pressure.
Conclusion:
Based on the technical indicators and analysis: - Trend: The stock is in a strong bullish trend. - Momentum: The overbought signals from RSI and Stochastic indicators suggest a potential pullback or consolidation in the short term. - Volatility: The widening Bollinger Bands indicate increased volatility, which could lead to sharp price movements. - Volume: The mixed signals from OBV and decreasing CMF suggest some distribution pressure.
Forecast:
Given the current technical indicators and the potential for a short-term pullback indicated by the overbought momentum indicators, the next few days may see a consolidation or minor correction in the stock price. However, the overall trend remains bullish, and any pullback could present a buying opportunity for investors looking to enter or add to their positions in VDC stock. It is essential to monitor the price action closely and consider risk management strategies to navigate the potential volatility in the market.