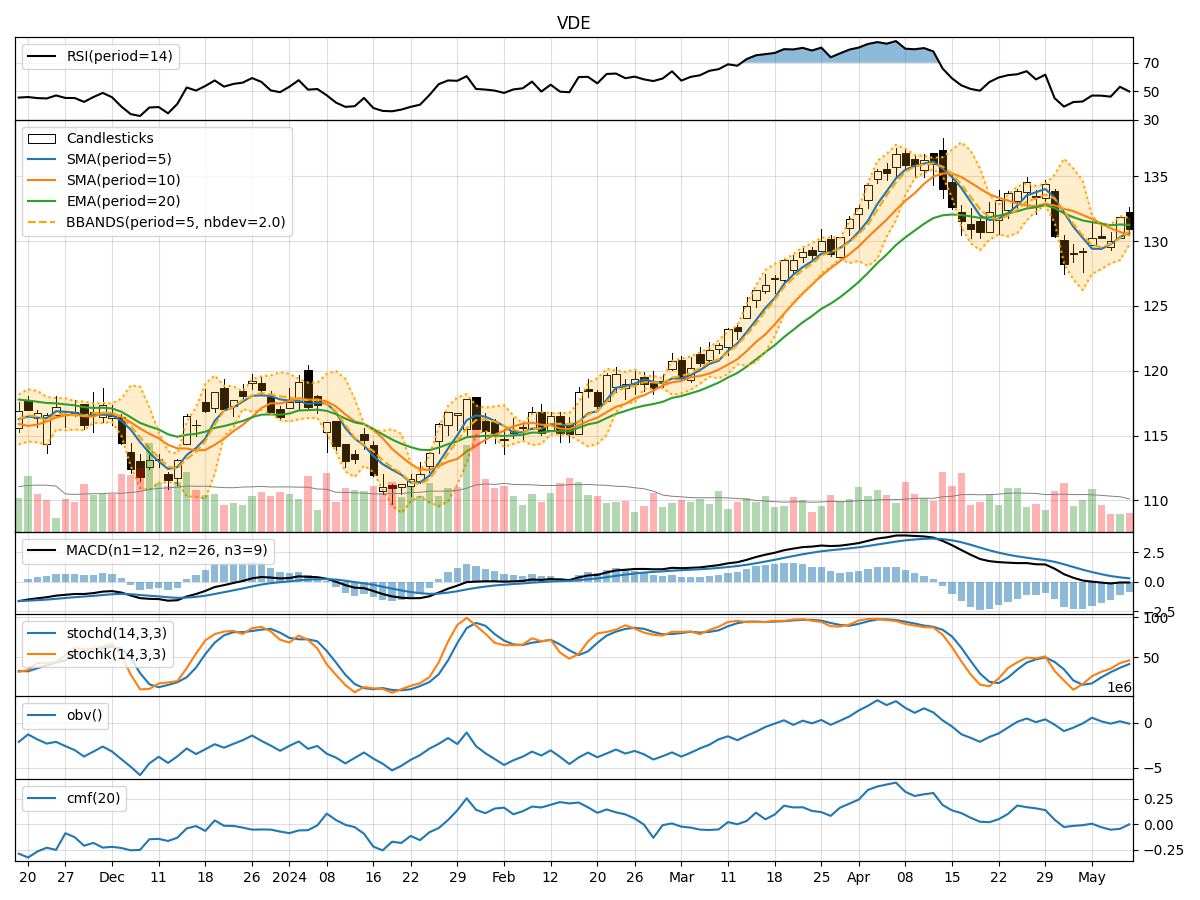
Technical Analysis of VDE 2024-05-10
Overview:
In analyzing the technical indicators for VDE over the last 5 days, we will delve into the trend, momentum, volatility, and volume indicators to provide a comprehensive assessment of the stock's potential price movement. By examining these key factors, we aim to offer valuable insights and predictions for the next few days.
Trend Analysis:
- Moving Averages (MA): The 5-day Moving Average (MA) has been fluctuating around the Simple Moving Average (SMA) and Exponential Moving Average (EMA) values, indicating a lack of clear trend direction.
- MACD: The Moving Average Convergence Divergence (MACD) has been consistently negative, suggesting a bearish momentum in the short term.
- Conclusion: The trend indicators point towards a bearish sentiment in the stock price movement.
Momentum Analysis:
- RSI: The Relative Strength Index (RSI) has been hovering around the mid-range, indicating a neutral momentum.
- Stochastic Oscillator: Both %K and %D values have been gradually increasing, suggesting a potential shift towards bullish momentum.
- Conclusion: The momentum indicators show a neutral to slightly bullish outlook for the stock.
Volatility Analysis:
- Bollinger Bands (BB): The stock price has been trading within the Bollinger Bands, with the bands narrowing, indicating decreasing volatility.
- Conclusion: Volatility indicators suggest a consolidation phase in the stock price.
Volume Analysis:
- On-Balance Volume (OBV): The OBV has been fluctuating, indicating indecision among investors regarding the stock.
- Chaikin Money Flow (CMF): The CMF has been close to zero, reflecting a lack of significant buying or selling pressure.
- Conclusion: Volume indicators signal a sideways movement in the stock price.
Conclusion:
Based on the analysis of trend, momentum, volatility, and volume indicators, the next few days' possible stock price movement for VDE is likely to be sideways with a slightly bullish bias. While the trend indicators suggest a bearish sentiment, the momentum indicators show a neutral to slightly bullish outlook. Volatility indicators point towards a consolidation phase, and volume indicators indicate a sideways movement with no clear buying or selling pressure.
Recommendation:
Considering the mixed signals from the technical indicators, it is advisable for investors to exercise caution and closely monitor the stock's price action in the coming days. It would be prudent to wait for more clarity in the trend direction before making any significant trading decisions.