Technical Analysis of VEA 2024-05-10
Overview:
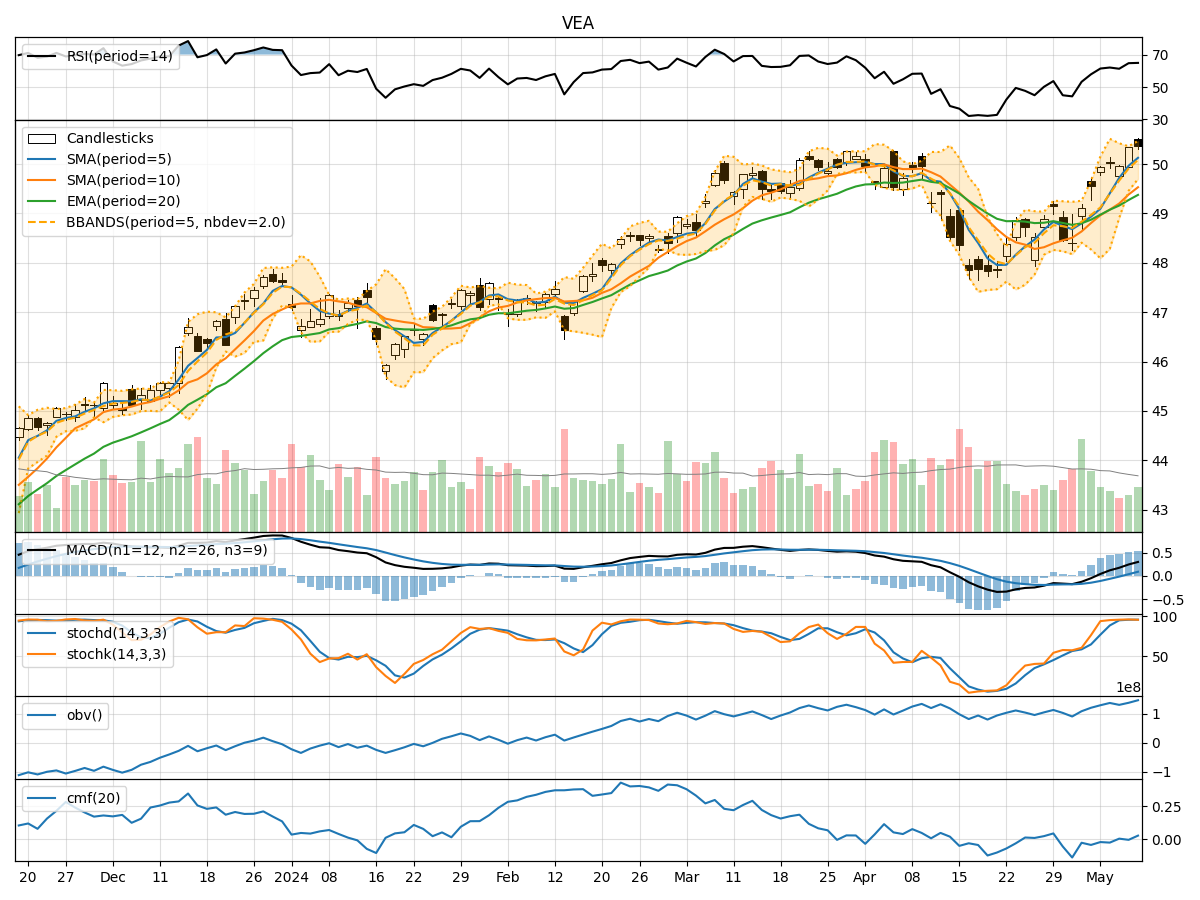
In analyzing the technical indicators for VEA over the last 5 days, we will delve into the trend, momentum, volatility, and volume indicators to provide a comprehensive outlook on the possible stock price movement in the coming days. By examining these key indicators, we aim to offer valuable insights and predictions to guide your investment decisions.
Trend Indicators:
- Moving Averages (MA): The 5-day MA has been consistently above the longer-term SMAs and EMAs, indicating a bullish trend.
- MACD: The MACD line has been trending upwards, with the MACD histogram showing positive values, suggesting bullish momentum.
- Conclusion: The trend indicators point towards an upward trajectory for VEA.
Momentum Indicators:
- RSI: The RSI has been in the overbought territory, indicating strong buying momentum.
- Stochastic Oscillator: Both %K and %D have been in the overbought zone, signaling potential for a pullback.
- Conclusion: Momentum indicators suggest a potential pullback due to overbought conditions.
Volatility Indicators:
- Bollinger Bands: The price has been trading within the bands, with the %B indicating a neutral position.
- Conclusion: Volatility indicators suggest a sideways movement or consolidation in the near term.
Volume Indicators:
- On-Balance Volume (OBV): The OBV has shown mixed signals, fluctuating without a clear trend.
- Chaikin Money Flow (CMF): The CMF has been hovering around the zero line, indicating indecision.
- Conclusion: Volume indicators reflect uncertainty in market sentiment.
Overall Conclusion:
Based on the analysis of trend, momentum, volatility, and volume indicators, the next few days for VEA are likely to see a sideways movement or consolidation with a potential pullback in price due to overbought conditions. Traders should exercise caution and wait for clearer signals before making significant trading decisions.