Technical Analysis of VEGI 2024-05-10
Overview:
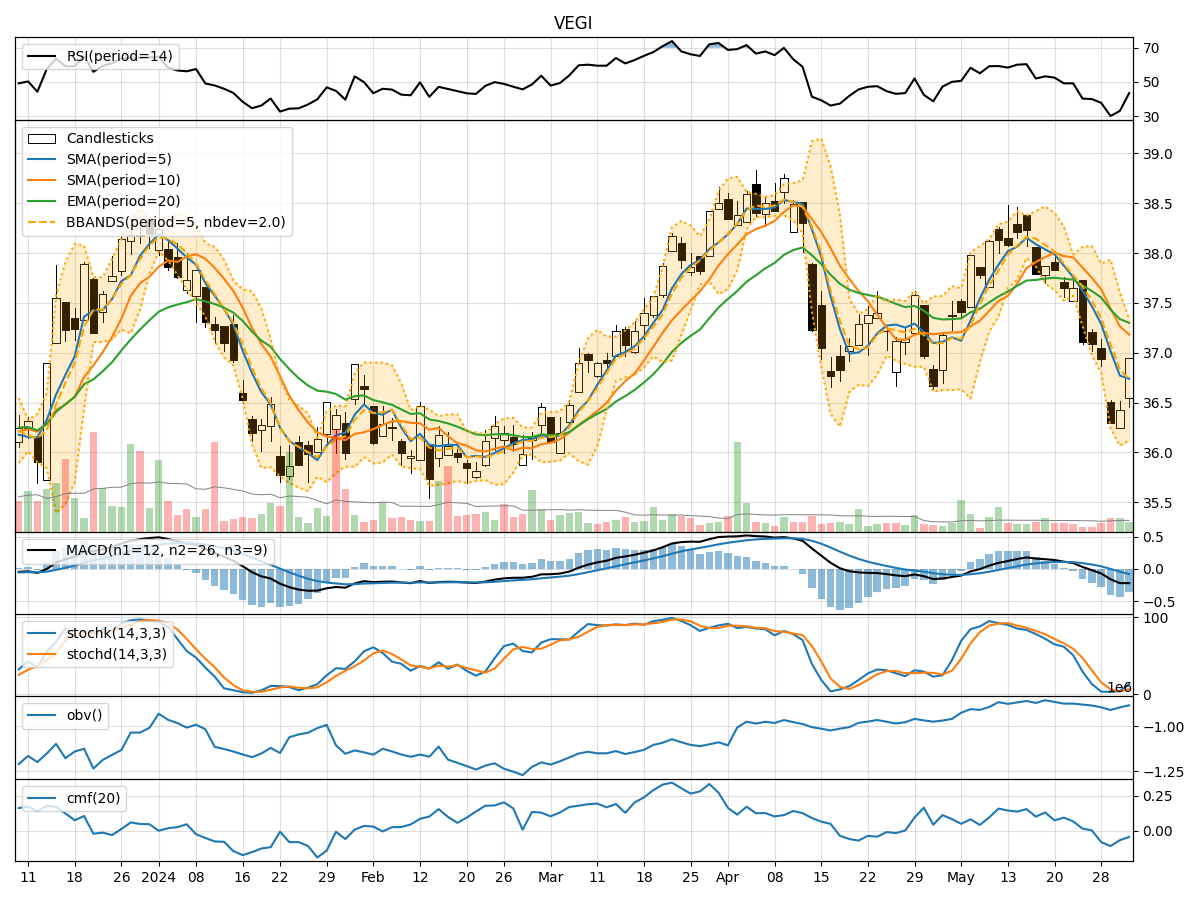
In analyzing the technical indicators for VEGI stock over the last 5 days, we will delve into the trends, momentum, volatility, and volume aspects to provide a comprehensive outlook. By examining these key indicators, we aim to forecast the possible stock price movement for the upcoming days.
Trend Analysis:
- Moving Averages (MA): The 5-day MA has been consistently above the closing prices, indicating a bullish trend.
- MACD: The MACD line has been above the signal line, suggesting a bullish momentum.
- EMA: The EMA has been trending upwards, supporting the bullish sentiment.
Key Observation: The trend indicators point towards a bullish outlook for VEGI stock.
Momentum Analysis:
- RSI: The RSI has been in the neutral zone, indicating neither overbought nor oversold conditions.
- Stochastic Oscillator: Both %K and %D have been in the overbought territory, signaling potential for a pullback.
- Williams %R: The indicator has been hovering around the oversold region, suggesting a possible reversal.
Key Observation: Momentum indicators show mixed signals, with a slight bias towards a potential pullback.
Volatility Analysis:
- Bollinger Bands (BB): The stock price has been trading within the bands, indicating stable volatility.
- Bollinger %B: The %B value has been fluctuating around the midline, reflecting a balanced market sentiment.
Key Observation: Volatility indicators suggest a period of consolidation and stability in price movement.
Volume Analysis:
- On-Balance Volume (OBV): The OBV has been trending upwards, indicating accumulation by investors.
- Chaikin Money Flow (CMF): The CMF has been positive, reflecting buying pressure in the stock.
Key Observation: Volume indicators support the bullish trend, showing increased buying interest in VEGI stock.
Conclusion:
Based on the analysis of trend, momentum, volatility, and volume indicators, the overall outlook for VEGI stock in the next few days is bullish. The trend indicators suggest a continued upward movement, supported by positive volume indicators. While momentum indicators show some signs of potential pullback, the overall sentiment remains positive. Volatility indicators point towards a period of consolidation before a potential continuation of the bullish trend.
In conclusion, the next few days are likely to see VEGI stock continuing its upward trajectory with intermittent periods of consolidation. Investors may consider maintaining a bullish stance and look for opportunities to enter or add to their positions during pullbacks for potential gains.