Technical Analysis of VERS 2024-05-10
Overview:
In analyzing the technical indicators for VERS over the last 5 days, we will delve into the trend, momentum, volatility, and volume indicators to provide a comprehensive outlook on the possible stock price movement in the coming days. By examining these key aspects, we aim to offer valuable insights and predictions for potential investors.
Trend Analysis:
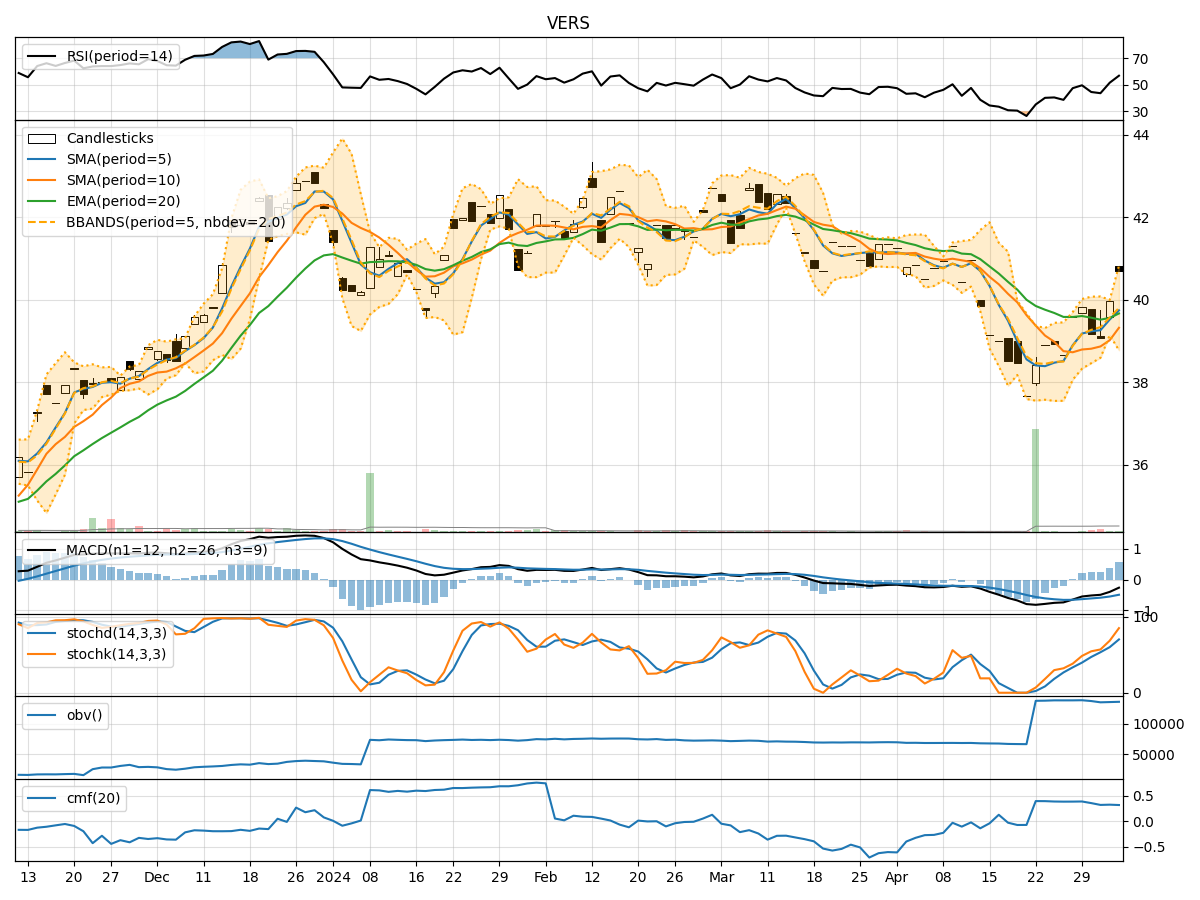
- Moving Averages (MA): The 5-day Moving Average (MA) has been consistently above the Simple Moving Average (SMA) and Exponential Moving Average (EMA), indicating a bullish trend.
- MACD: The Moving Average Convergence Divergence (MACD) has shown positive values, with the MACD line consistently above the Signal line, suggesting bullish momentum.
Momentum Analysis:
- RSI: The Relative Strength Index (RSI) has been gradually decreasing but remains above the oversold threshold of 30, indicating a potential consolidation phase.
- Stochastic Oscillator: Both %K and %D values have been declining, signaling a potential bearish momentum.
Volatility Analysis:
- Bollinger Bands (BB): The stock price has been trading within the Bollinger Bands, with the bands narrowing, suggesting decreasing volatility.
Volume Analysis:
- On-Balance Volume (OBV): The OBV has been relatively stable, indicating a balance between buying and selling pressure.
- Chaikin Money Flow (CMF): The CMF has shown a slight increase, suggesting a positive inflow of money into the stock.
Key Observations:
- The trend indicators point towards a bullish sentiment in the short term.
- Momentum indicators indicate a potential shift towards a bearish momentum.
- Volatility is decreasing, suggesting a period of consolidation.
- Volume indicators show a balanced buying and selling pressure.
Conclusion:
Based on the analysis of the technical indicators, the next few days for VERS stock price movement could see sideways consolidation with a slight bearish bias. Investors should closely monitor the momentum indicators for any potential reversal signals. It is advisable to exercise caution and wait for clearer signals before making significant trading decisions.