Technical Analysis of VFLO 2024-05-10
Overview:
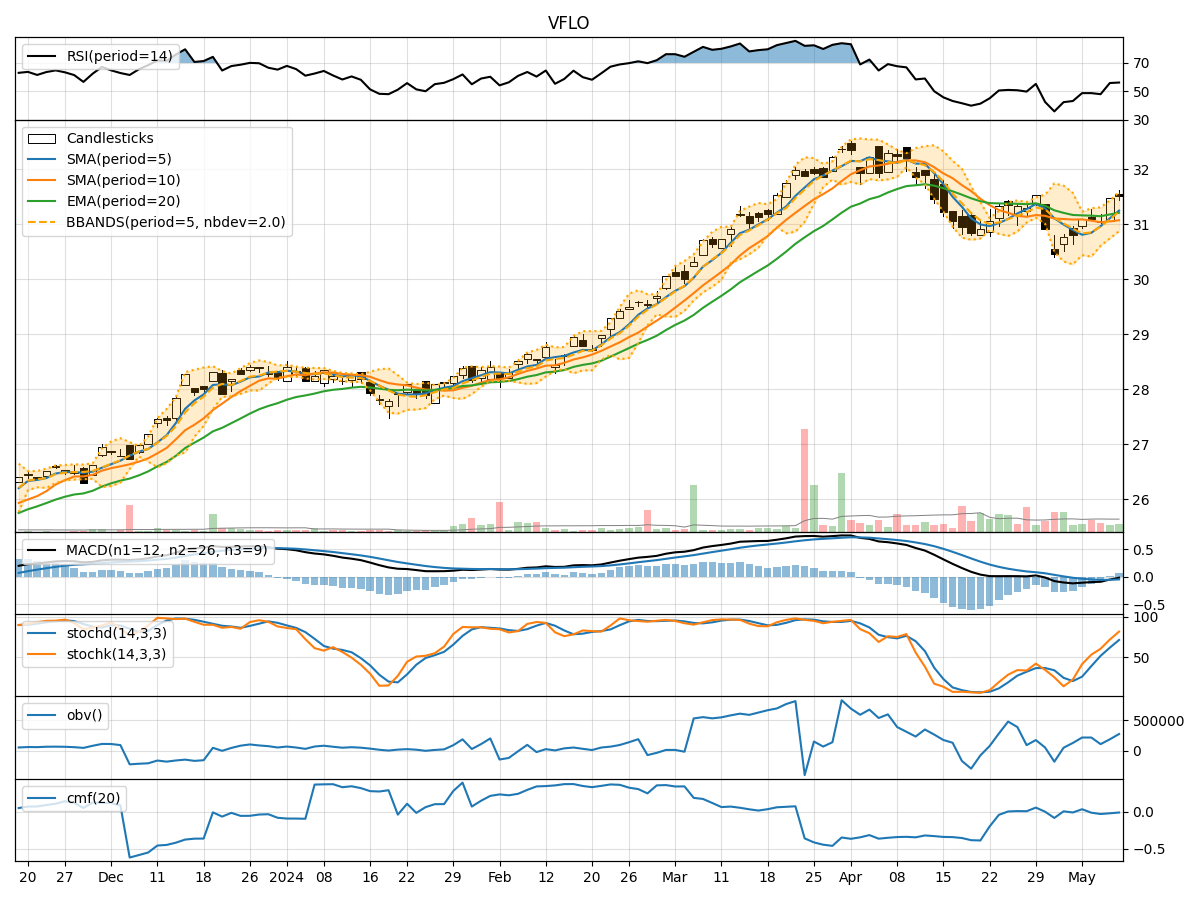
In analyzing the technical indicators for VFLO over the last 5 days, we will delve into the trend, momentum, volatility, and volume indicators to provide a comprehensive assessment of the stock's potential price movement. By examining these key factors, we aim to offer valuable insights and predictions for the next few days.
Trend Analysis:
- Moving Averages (MA): The 5-day Moving Average (MA) has been showing a slight uptrend, indicating a positive momentum in the short term.
- MACD: The Moving Average Convergence Divergence (MACD) has been fluctuating around the zero line, suggesting a lack of clear trend direction.
- EMA: The Exponential Moving Average (EMA) has been relatively stable, indicating a potential consolidation phase.
Momentum Analysis:
- RSI: The Relative Strength Index (RSI) has been hovering around the mid-level, indicating a neutral momentum.
- Stochastic Oscillator: Both %K and %D of the Stochastic Oscillator have been rising, signaling a strengthening momentum.
- Williams %R: The Williams %R is in the oversold territory, suggesting a potential buying opportunity.
Volatility Analysis:
- Bollinger Bands: The Bollinger Bands have been narrowing, indicating decreasing volatility and a possible period of consolidation.
- Bollinger %B: The %B indicator is below 1, suggesting the stock is trading below the lower Bollinger Band, potentially indicating an oversold condition.
Volume Analysis:
- On-Balance Volume (OBV): The OBV has shown mixed signals, with fluctuations in volume accumulation.
- Chaikin Money Flow (CMF): The CMF has been negative, indicating some selling pressure in the stock.
Key Observations:
- The stock is currently in a consolidation phase with mixed signals from various indicators.
- Momentum indicators suggest a potential uptick in buying pressure.
- Volatility is decreasing, indicating a possible period of stability.
- Volume indicators show a lack of strong accumulation or distribution signals.
Conclusion:
Based on the analysis of the technical indicators, the next few days for VFLO could see sideways movement with a slight upward bias. The stock is likely to consolidate within a range, with potential for a modest uptrend based on improving momentum indicators. Traders may consider monitoring key support and resistance levels for potential entry and exit points. It is advisable to exercise caution and wait for clearer signals before making significant trading decisions.