Technical Analysis of VFMO 2024-05-10
Overview:
In analyzing the technical indicators for VFMO over the last 5 days, we will delve into the trend, momentum, volatility, and volume indicators to provide a comprehensive outlook on the possible stock price movement in the coming days.
Trend Analysis:
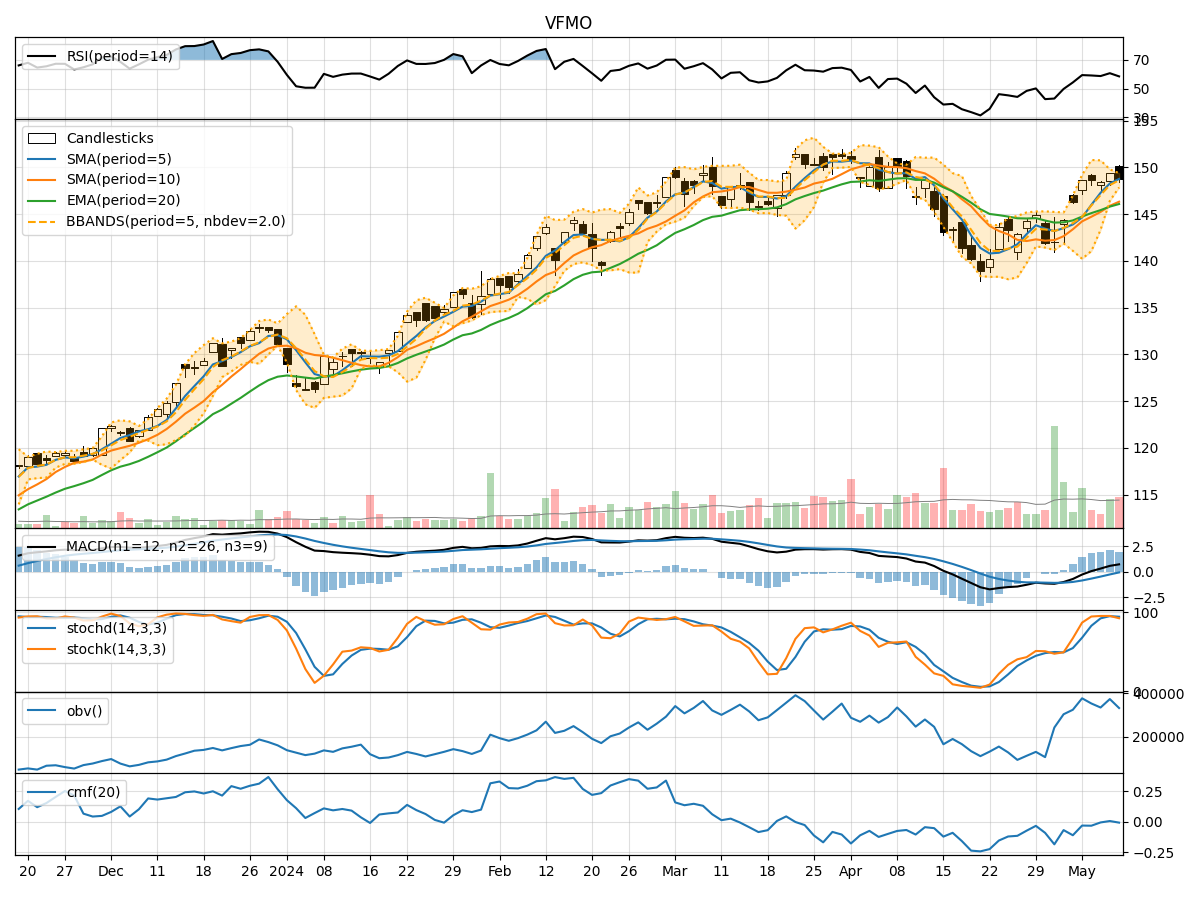
- Moving Averages (MA): The 5-day Moving Average has been consistently above the Simple Moving Average (SMA) and Exponential Moving Average (EMA), indicating a bullish trend.
- MACD: The MACD line has been above the signal line, suggesting a positive momentum in the stock price.
- RSI: The Relative Strength Index (RSI) has been fluctuating around the 60-70 range, indicating a neutral to slightly bullish sentiment.
Momentum Analysis:
- Stochastic Oscillator: The Stochastic Oscillator has been in the overbought territory, suggesting a potential reversal or consolidation.
- Williams %R: The Williams %R indicator has shown oversold conditions on the last trading day, indicating a possible bullish reversal.
Volatility Analysis:
- Bollinger Bands: The Bollinger Bands have been narrowing, indicating decreasing volatility in the stock price.
- Average True Range (ATR): ATR has been relatively stable, suggesting a lack of significant price fluctuations.
Volume Analysis:
- On-Balance Volume (OBV): The OBV has shown mixed movements, indicating indecision among investors.
- Chaikin Money Flow (CMF): The CMF has been negative, suggesting outflow of money from the stock.
Key Observations:
- The trend indicators suggest a bullish sentiment in the stock price.
- Momentum indicators show a potential for a reversal or consolidation due to overbought conditions.
- Volatility indicators point towards decreasing price fluctuations.
- Volume indicators reflect mixed investor sentiment with a slight negative bias.
Conclusion:
Based on the analysis of the technical indicators, the next few days' possible stock price movement for VFMO is likely to be sideways to slightly bullish. While the trend indicators support a bullish outlook, the overbought conditions in momentum indicators and negative money flow in volume indicators suggest a potential for consolidation or a minor pullback. Traders should closely monitor key support and resistance levels for potential entry or exit points.