Technical Analysis of VFMV 2024-05-10
Overview:
In analyzing the technical indicators for VFMV stock over the last 5 days, we will delve into the trend, momentum, volatility, and volume indicators to provide a comprehensive outlook on the possible stock price movement in the coming days. By examining these key aspects, we aim to offer valuable insights and predictions for informed decision-making.
Trend Indicators:
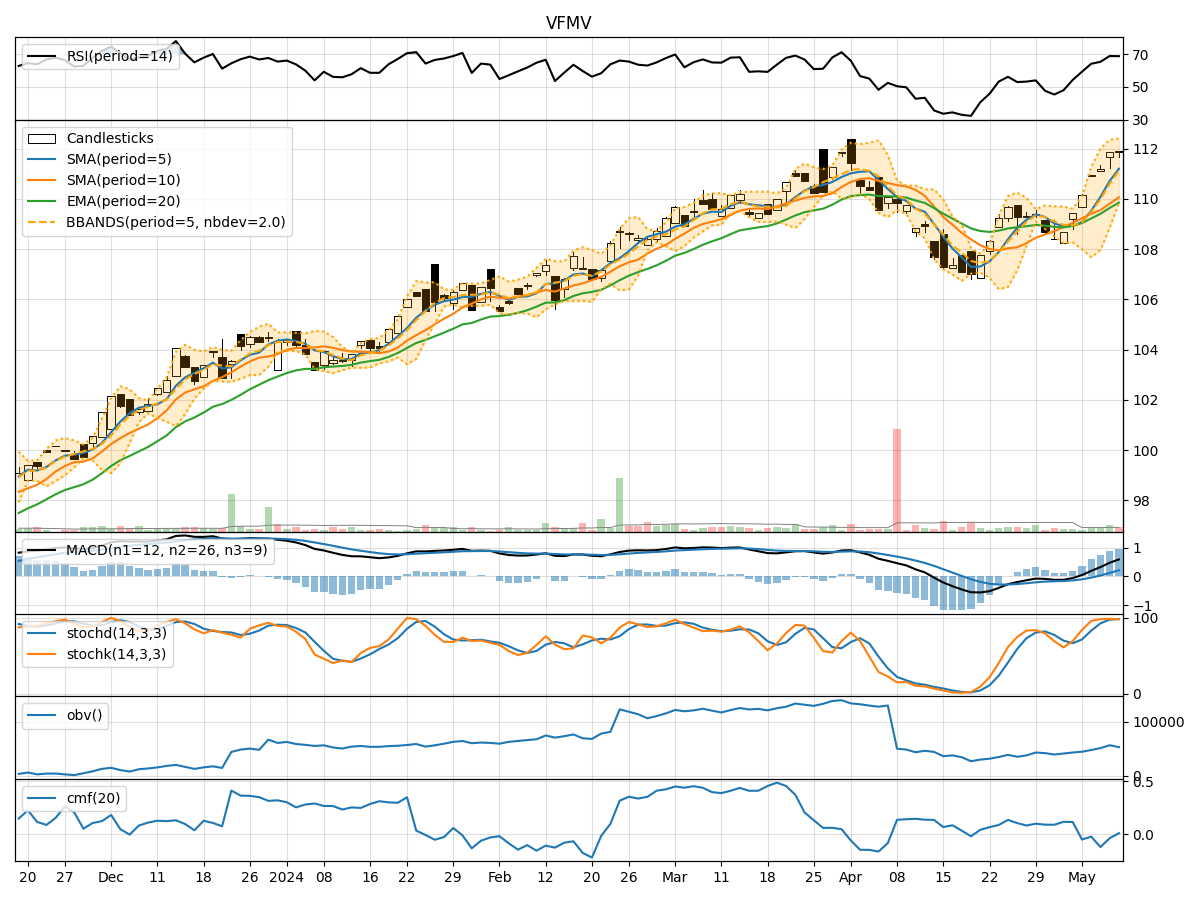
- Moving Averages (MA): The 5-day MA has been consistently trending upwards, indicating a positive momentum in the stock price.
- MACD: The MACD line has been above the signal line for the past few days, suggesting a bullish trend.
- RSI: The RSI has been in the overbought territory, indicating a strong bullish momentum.
Momentum Indicators:
- Stochastic Oscillator: Both %K and %D have been in the overbought zone, signaling a potential reversal or consolidation.
- Williams %R: The indicator has been fluctuating around the oversold region, suggesting a mixed sentiment among traders.
Volatility Indicators:
- Bollinger Bands: The stock price has been trading within the bands, indicating a period of consolidation.
- Average True Range (ATR): The ATR value has been relatively stable, suggesting consistent volatility levels.
Volume Indicators:
- On-Balance Volume (OBV): The OBV has shown a slight decline, indicating some selling pressure in the stock.
- Chaikin Money Flow (CMF): The CMF has been negative, reflecting a bearish sentiment in the market.
Key Observations:
- The trend indicators suggest a bullish outlook with the moving averages and MACD signaling upward momentum.
- Momentum indicators show a potential overbought condition, hinting at a possible correction or consolidation.
- Volatility indicators point towards a period of consolidation with stable volatility levels.
- Volume indicators indicate a slight increase in selling pressure and a bearish sentiment in the market.
Conclusion:
Based on the analysis of the technical indicators, the stock is likely to experience some consolidation or a minor pullback in the coming days. The bullish trend may pause temporarily due to overbought conditions and increased selling pressure. Traders should exercise caution and consider potential entry points during dips for long-term positions. It is advisable to closely monitor key support and resistance levels for better risk management.