Technical Analysis of VFQY 2024-05-10
Overview:
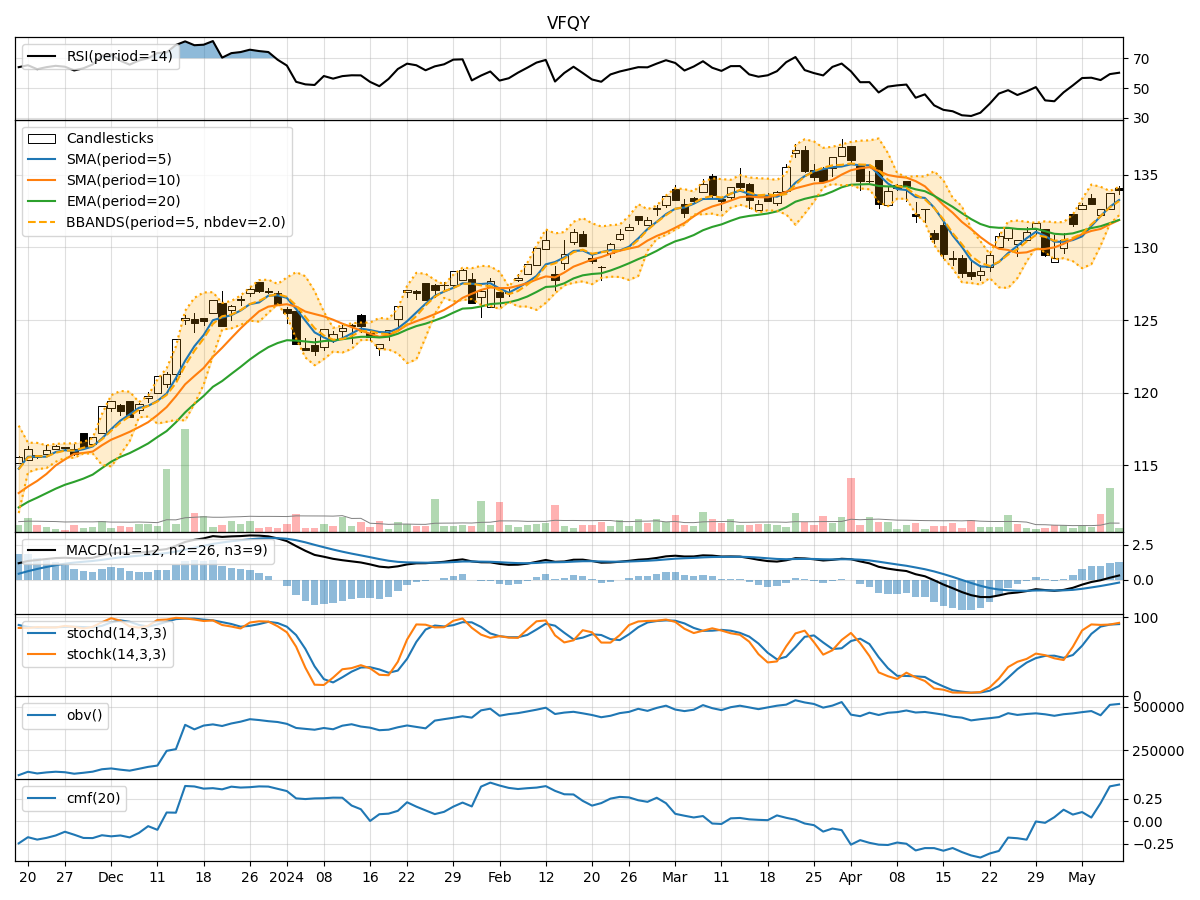
In the last 5 trading days, VFQY stock has shown mixed signals across various technical indicators. The stock price has been fluctuating within a certain range, with some indicators suggesting potential bullish momentum while others indicating a possible consolidation phase. Let's delve deeper into each category of technical indicators to provide a comprehensive analysis and make a prediction for the next few days.
Trend Indicators:
- Moving Averages (MA): The 5-day Moving Average (MA) has been trending above the Simple Moving Average (SMA) and Exponential Moving Average (EMA), indicating a short-term bullish trend.
- MACD: The Moving Average Convergence Divergence (MACD) has been positive, with the MACD line consistently above the signal line, suggesting bullish momentum.
- Conclusion: The trend indicators point towards an upward movement in the stock price.
Momentum Indicators:
- RSI: The Relative Strength Index (RSI) has been fluctuating around the neutral level, indicating a lack of strong momentum.
- Stochastic Oscillator: Both %K and %D have been in the overbought zone, suggesting a potential reversal or consolidation.
- Conclusion: The momentum indicators are mixed, with a slight bias towards a sideways movement.
Volatility Indicators:
- Bollinger Bands (BB): The stock price has been trading within the Bollinger Bands, with the bands narrowing, indicating decreasing volatility.
- Conclusion: Volatility is decreasing, signaling a potential consolidation phase.
Volume Indicators:
- On-Balance Volume (OBV): The OBV has shown mixed signals, with fluctuations in volume indicating indecision among traders.
- Chaikin Money Flow (CMF): The CMF has been positive, suggesting buying pressure in the market.
- Conclusion: Volume indicators suggest indecisiveness among traders, with a slight bullish bias.
Overall Conclusion:
Based on the analysis of trend, momentum, volatility, and volume indicators, the next few days for VFQY stock are likely to see a sideways movement with a slight upward bias. The trend indicators point towards a potential upward movement, while momentum indicators suggest a lack of strong momentum. Volatility is decreasing, indicating a consolidation phase, and volume indicators show mixed signals.
Recommendation:
- Short-term Traders: Consider taking advantage of potential short-term bullish movements indicated by trend indicators.
- Long-term Investors: Monitor the stock closely for a clearer trend confirmation before making significant investment decisions.
In conclusion, while the technical indicators provide valuable insights, it is essential to consider other fundamental factors and market dynamics before making any investment decisions. Stay vigilant and adapt your strategy based on real-time market developments.