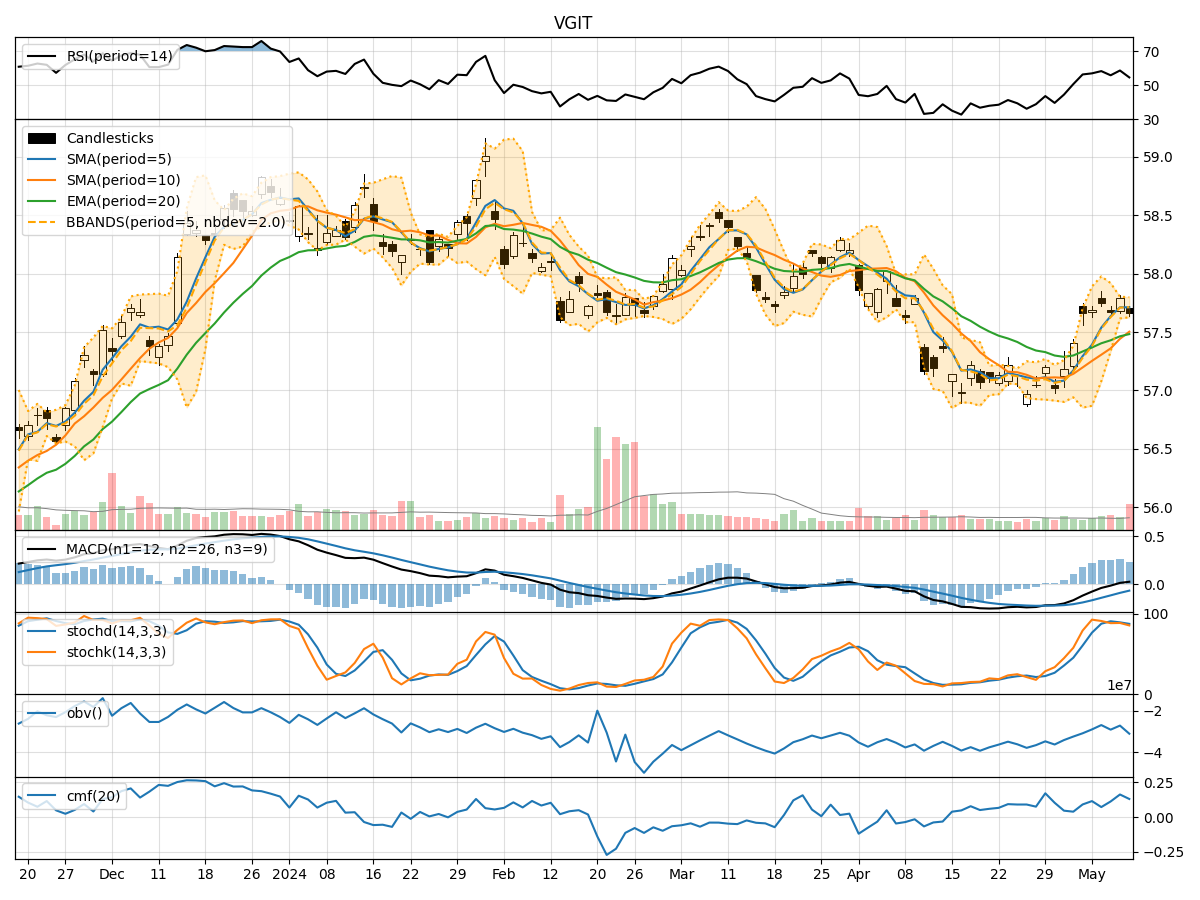
Technical Analysis of VGIT 2024-05-10
Overview:
In analyzing the technical indicators for VGIT over the last 5 days, we will delve into the trend, momentum, volatility, and volume indicators to provide a comprehensive outlook on the possible stock price movement. By examining these key aspects, we aim to offer valuable insights and predictions for the upcoming trading days.
Trend Analysis:
- Moving Averages (MA): The 5-day Moving Average (MA) has been consistently above the Simple Moving Average (SMA) and Exponential Moving Average (EMA), indicating a bullish trend.
- MACD: The MACD line has been positive, with the MACD Histogram showing an increasing trend, suggesting bullish momentum.
Momentum Analysis:
- RSI: The Relative Strength Index (RSI) has been relatively high, indicating overbought conditions.
- Stochastic Oscillator: Both %K and %D have been declining, signaling a potential reversal in momentum.
Volatility Analysis:
- Bollinger Bands (BB): The stock price has been trading within the Bollinger Bands, with the bands narrowing, suggesting reduced volatility.
Volume Analysis:
- On-Balance Volume (OBV): The OBV has been fluctuating, indicating mixed buying and selling pressure.
- Chaikin Money Flow (CMF): The CMF has been positive, reflecting buying pressure in the market.
Key Observations:
- The trend indicators suggest a bullish sentiment, supported by the positive MACD.
- Momentum indicators show signs of overbought conditions and a potential reversal in momentum.
- Volatility has been decreasing, indicating a possible period of consolidation.
- Volume indicators reflect mixed buying and selling pressure in the market.
Conclusion:
Based on the analysis of the technical indicators, the next few days for VGIT could see sideways movement or consolidation as the stock price may trade within a narrow range. The bullish trend may continue in the short term, but the overbought conditions and declining momentum indicators suggest a potential pullback or correction. Traders should exercise caution and consider taking profits or implementing risk management strategies. It is advisable to closely monitor key support and resistance levels for potential entry or exit points.