Technical Analysis of VGSR 2024-05-10
Overview:
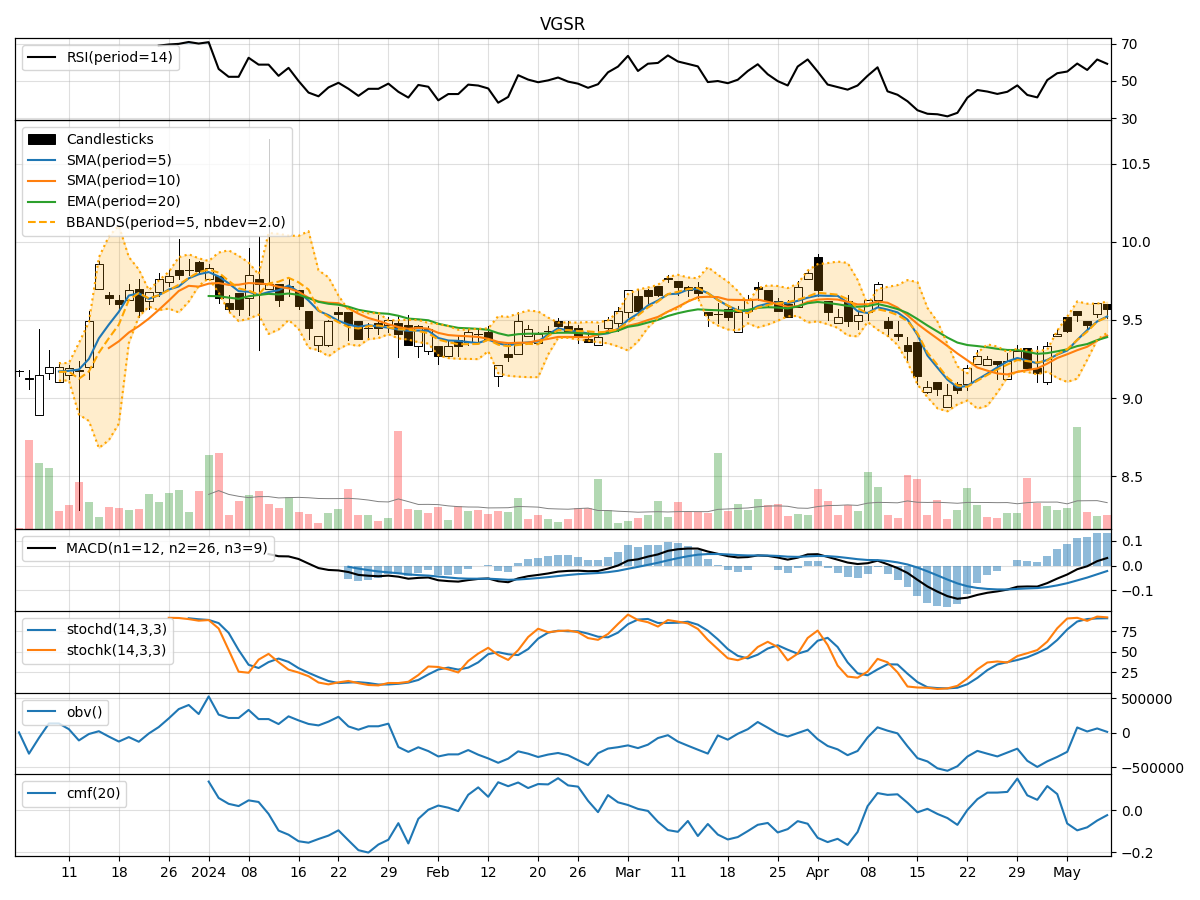
In analyzing the technical indicators for VGSR over the last 5 days, we will delve into the trend, momentum, volatility, and volume indicators to provide a comprehensive outlook on the possible stock price movement. By examining these key aspects, we aim to offer valuable insights and predictions for the upcoming days.
Trend Analysis:
- Moving Averages (MA): The 5-day Moving Average (MA) has been trending above the Simple Moving Average (SMA) and Exponential Moving Average (EMA), indicating a bullish trend.
- MACD: The Moving Average Convergence Divergence (MACD) has been positive, with the MACD line consistently above the signal line, suggesting bullish momentum.
- RSI: The Relative Strength Index (RSI) has been fluctuating around the neutral zone, indicating a balanced market sentiment.
Momentum Analysis:
- Stochastic Oscillator: Both %K and %D have been in the overbought territory, signaling a potential reversal or consolidation.
- Williams %R: The Williams %R is hovering near oversold levels, suggesting a possible buying opportunity.
Volatility Analysis:
- Bollinger Bands: The stock price has been trading within the Bollinger Bands, with the bands widening slightly, indicating increased volatility.
- Average True Range (ATR): The ATR has shown moderate volatility levels over the past few days.
Volume Analysis:
- On-Balance Volume (OBV): The OBV has been fluctuating, indicating mixed buying and selling pressure.
- Chaikin Money Flow (CMF): The CMF has been negative, suggesting a bearish money flow trend.
Key Observations:
- The trend indicators suggest a bullish sentiment, supported by positive MACD and moving averages.
- Momentum indicators show signs of potential reversal or consolidation due to overbought conditions.
- Volatility has slightly increased, as seen in the widening Bollinger Bands.
- Volume indicators reflect mixed market participation, with a negative CMF indicating bearish money flow.
Conclusion:
Based on the analysis of technical indicators, the stock price of VGSR is likely to experience further upward movement in the coming days, supported by the bullish trend and positive momentum. However, traders should be cautious of potential reversals indicated by overbought conditions in the stochastic oscillator. Overall, the outlook remains bullish with a possibility of short-term consolidation before resuming the upward trajectory.