Technical Analysis of VIDI 2024-05-10
Overview:
In analyzing the technical indicators for VIDI over the last 5 days, we will delve into the trend, momentum, volatility, and volume indicators to provide a comprehensive outlook on the possible stock price movement in the coming days. By examining these key aspects, we aim to offer valuable insights and recommendations for potential investors.
Trend Indicators:
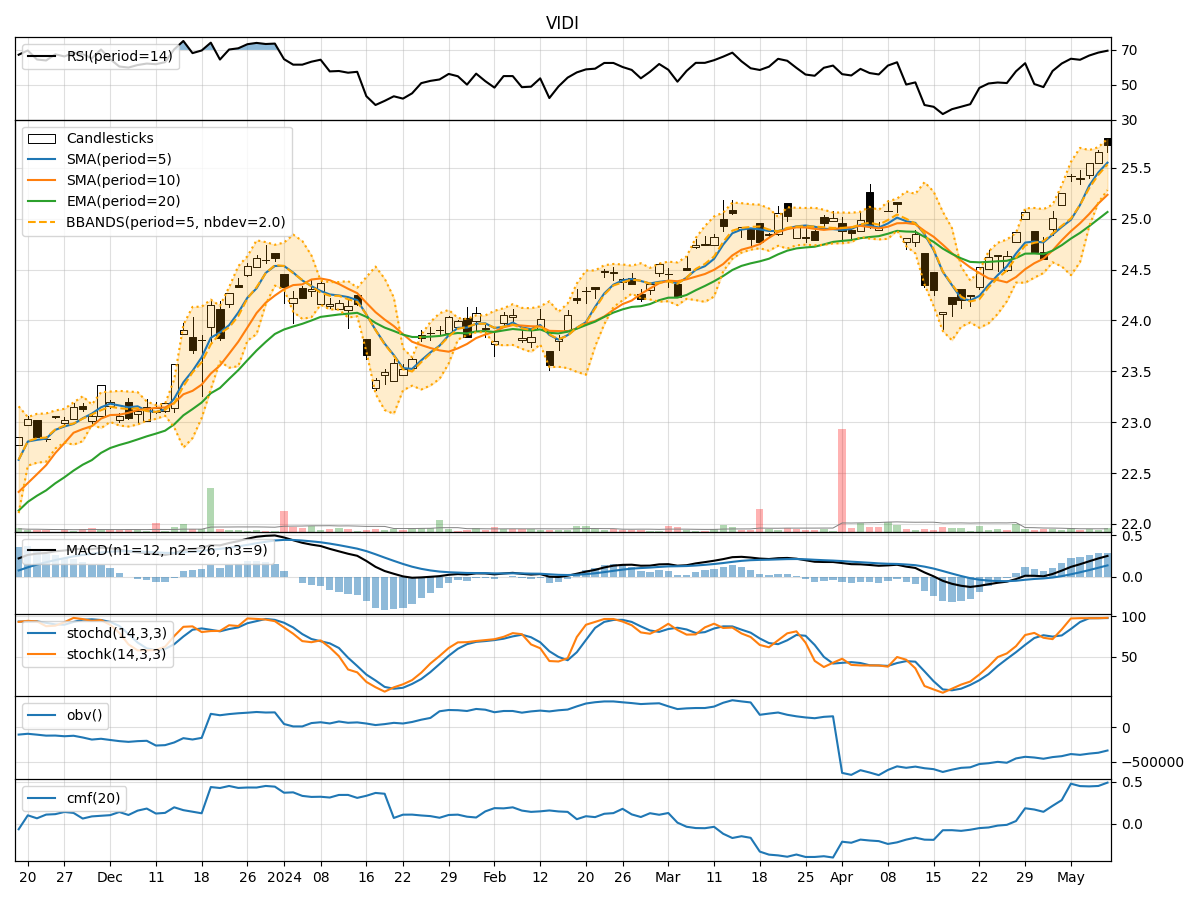
- Moving Averages (MA): The 5-day MA has been consistently above the longer-term SMAs and EMAs, indicating a short-term uptrend.
- MACD: The MACD line has been above the signal line, with both showing an increasing trend, suggesting bullish momentum.
- MACD Histogram: The histogram has been rising, indicating strengthening bullish momentum.
Momentum Indicators:
- RSI: The RSI has been trending upwards and is currently in the overbought territory, suggesting a strong bullish momentum.
- Stochastic Oscillator: Both %K and %D lines are in the overbought zone, indicating a potential reversal or consolidation.
- Williams %R: The indicator is in the oversold region, signaling a potential reversal to the upside.
Volatility Indicators:
- Bollinger Bands: The stock price has been trading within the bands, with the bands narrowing, indicating decreasing volatility.
- Bollinger %B: The %B indicator is hovering around the middle, suggesting a balanced market sentiment.
Volume Indicators:
- On-Balance Volume (OBV): The OBV has been fluctuating but generally showing a slight decrease, indicating some distribution.
- Chaikin Money Flow (CMF): The CMF has been positive, indicating buying pressure in the market.
Key Observations:
- The trend indicators suggest a strong bullish sentiment in the short term.
- Momentum indicators indicate a potential overbought condition, signaling a need for caution.
- Volatility indicators point towards decreasing volatility and a possible period of consolidation.
- Volume indicators show mixed signals, with OBV indicating some distribution but CMF reflecting buying pressure.
Conclusion:
Based on the analysis of the technical indicators, the next few days' possible stock price movement for VIDI is likely to experience a period of consolidation. While the trend remains bullish in the short term, the overbought conditions in the momentum indicators and decreasing volatility signal a potential slowdown in price movement. Investors should exercise caution and monitor the price action closely for any signs of a reversal or continuation of the current trend.